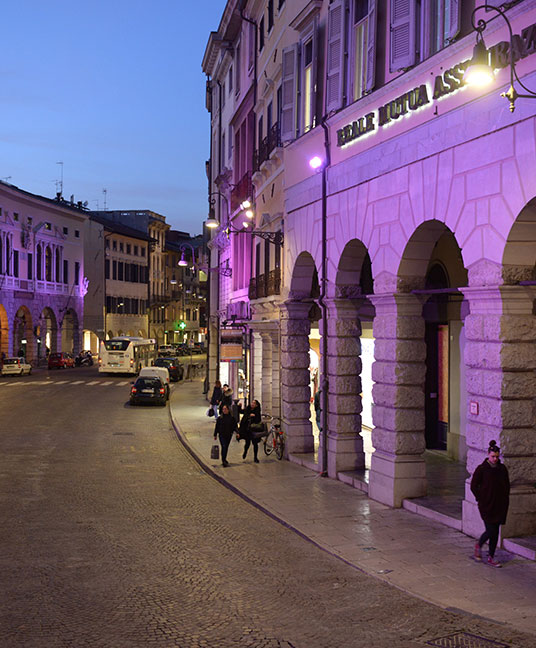
Hera Luce
Hera Luce, the public lighting benefit company of the Hera Group, has embraced the model of the Smart Sustainable City.
A clear objective, that of working alongside cities to design and propose concrete solutions in terms of respect for the environment, circular economy, safety and quality of life, with the goals of the UN’s 2030 Agenda and European decarbonisation policies as guidelines.
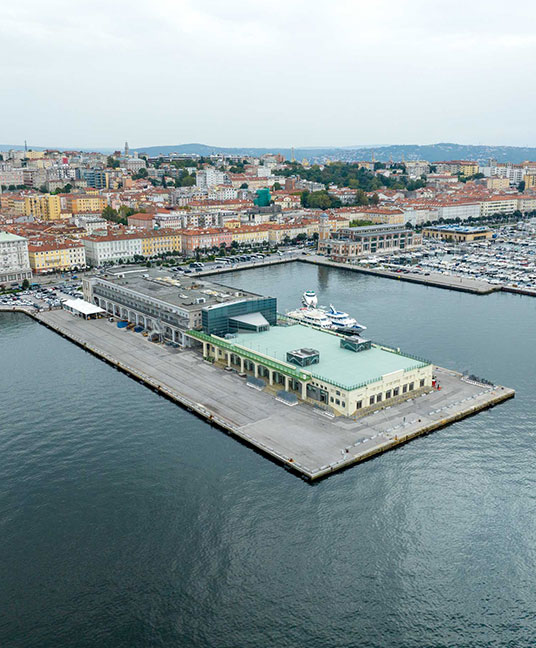
Smart Grid
By 2026, Trieste will enter a new energy era, and the network expansion planned by AcegasApsAmga will be able to support the city's increased electricity consumption.
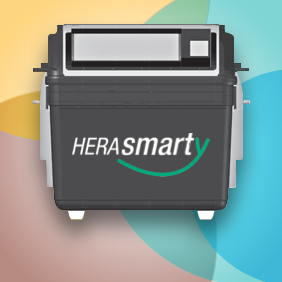

Smart cities and telecommunications go hand in hand
Discover HERABIT's innovative solutions designed to optimise and enhance a company's potential, promoting efficiency and growth.

