
M&A
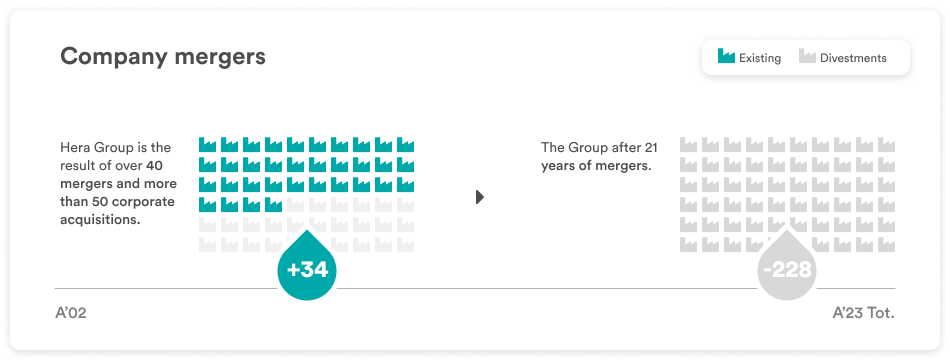
Hera's history demonstrates the effectiveness of the model for expansion that has allowed the Group to quintuple its size over 20 years, since its establishment, with a significant contribution coming from M&As (40% of growth created with M&As).
Further M&A operations are also foreseen in the new Business Plan to 2029
The model was designed to be "open" to external growth, with an inclusive governance that allows the group of shareholders to be widened, taking in new shareholders in exchange for the contribution coming from their business activities. The Group's diversified set of shareholders, unique in the multi-utility sector, facilitates this kind of expansion.
The strategy of expansion through M&As represents an important source of value creation. Since the transactions were carried out with non dilutive multiples, shareholders can rely on the extraction of synergies (which lead to the creation of value) from mergers that make the most of scale economies and cross selling. In the past, this strategy has guaranteed an average increase in the Ebitda of merged companies coming to +25% in less than 5 years.
The strategy of external growth through M&As marks the transactions with "Mono-business" target companies and "Multi-utility" companies.
In the first case, Mono-business companies mainly include those involved in free market activities (waste treatment and energy sales) and generally owned by private entrepreneurs, which allows a transaction for a "cash" acquisition. As regards the geographic scope, even though the market is national and not local, Hera concentrates its areas for potential expansion along the Adriatic coast for activities in Commodity sales. In the waste treatment market, instead, the scope is national, since plants that are close to the customer are strategic (to reduce costs in logistics). Hera is indeed the nation's leader in this sector, by quantity of plants and volumes managed.
In the second case, Multi-utility companies are mainly owned by local authorities (Municipalities), with geographically localised activities that often concern concessions for services (water, waste collection, gas and electricity distribution). The geographic scope involves areas bordering with the reference area, i.e. North-Eastern Italy (Emilia-Romagna, Marche and Triveneto regions), since the speed and amount of the synergies that can be extracted from mergers are increased by geographical proximity. These transactions can take the form of mergers with the "partner" company in which the owners generally prefer to become Group shareholders. These transactions are usually carried out with exchanges of shares between the parties.
Hera will continue to focus on M&A transactions, selecting investments that offer potential synergies and are complementary to the Group's current activity portfolio: particular attention will go so selecting the targets (multi-utilities, in addition to companies involved in energy sales and waste treatment) in parts of the nation held to be strategic for each activity.
The projections included in the new plan to 2029 are based on a market analysis and the Group's track record. The goal for 2029 is for growth through M&As to contribute to Ebitda with +100m€.
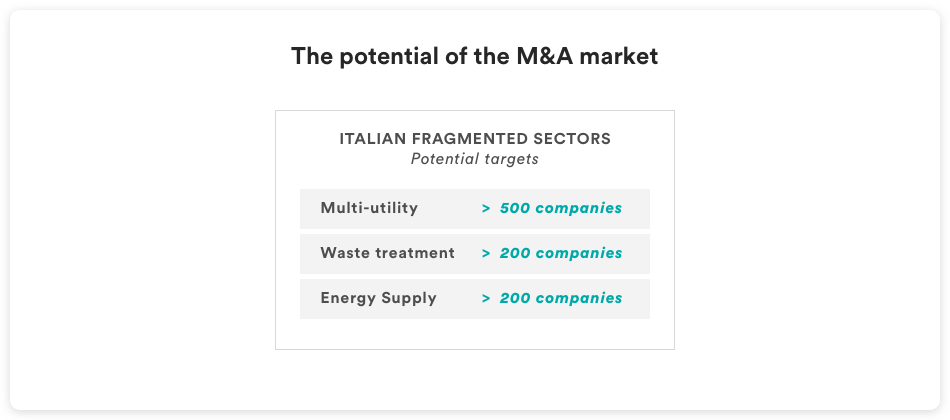
The ways in which this target will be reached depend on the opportunities offered by a market which is still highly fragmentary and contains an excessive number of small-medium enterprises with a sub-optimal size, that have difficulty in remaining effectively and efficiently on the market. The wide range of options concerns all sectors in which the Group is active, i.e. multi-utilities, energy sales or waste treatment.
Hera Group's focus on core business areas (Water, Waste, Energy) and streamlining of company structure has resulted in a major divestment/rationalization policy.
Divestments/rationalizations are underpinned by the following strategies:
- Streamlining/financing development
- Organizational focus
The numerous rationalization operations were in response to the need for a more efficient governance structure able to deliver significant cost savings.
M&A track record
| COMPANY | BUSINESS/ACTIVITIES | PRESS RELEASE/PRESENTATION | % STAKE |
|---|---|---|---|
| Ambiente Energia Srl | Waste services | 22/07/2025 | 100% |
| EstEnergy | Electricity and gas sales | 16/12/2024 | 100% |
| TRS Ecology | Waste services | 30/07/2024 | 70% |
| SOELIA | Distribution networks | 11/06/2024 | 100% |
| ASCO TLC | IT-TLC | 27/09/2023 | 100% |
| Tiepolo srl | Energy efficiency | 06/07/2023 | 100% |
|
F.lli Franchini Srl |
Electricity services |
60% | |
|
A.C.R. di Reggiani Albertino Spa |
Waste services |
60% | |
|
Macero Maceratese |
Waste services |
70% | |
|
Con Energia S.p.A. |
Energy sales |
13/04/2022 | 100% |
| Gruppo Vallortigara | Waste services | 09/09/2021 | 80% |
| Recycla SRL | Waste services | 30/06/2021 | 70% |
| EstEnergy (Joint Venture with Ascopiave) | Electricity and gas sales | 19/12/2019 | 52% |
| Pistoia Ambiente | Waste management services | 30/07/2019 | 100% |
| Cosea Ambiente | Waste services | 09/05/2019 | 100% |
| CMV Servizi | Gas distribution | 26/02/2019 | 100% |
| CMV Energia e Impianti | Electricity and gas sales | 26/02/2019 | 100% |
| Sangroservizi | Electricity and gas sales | 20/03/2018 | 100% |
| Megas.net | Gas distribution | 07/03/2018 | 100% |
| Blu Ranton | Electricity and gas sales | 08/02/2018 | 100% |
| Teseco | Waste services | 30/01/17 | 100% |
| Aliplast | Waste services | 11/01/17 | 100% |
| Gran Sasso | Electricity and gas sales | 06/10/16 | 100% |
| Julia servizi più | Electricity and gas sales | 08/04/16 | 100% |
| Geo Nova | Waste services | 29/12/2015 | 100% |
| Waste Recycling | Waste services | 23/12/2015 | 100% |
| Alento gas | Gas sales | 26/01/2015 | 100% |
| Ecoenergy | Waste services | 27/11/2014 | 100% |
| Amga Udine | Multi utility | 25/06/2014 | 100% |
| Fucino gas | Gas sales | 13/01/2014 | 100% |
| Est Reti Elettriche | Electricity distribution | 12/12/2013 | 100% |
| Isontina Reti Gas | Gas distribution | 30/09/2013 | 100% |
| AcegasAps | Multi-utility | 25/07/2012 Analyst presentation |
100% |
| Sadori | Gas sales | 14/04/2011 | 50% |
| Enomondo | Biomass combustion plant | 11/01/2011 | 40% |
| Aimag | Multi-utility | 12/10/2009 | 25% |
| Tamarete Energia | CCGT | 17/12/2008 | 32% |
| Megas Trade | Electricity and gas sales | 28/07/2008 | 100% |
| SAT | Multi-utility | 16/10/2007 23/07/2007 08/08/2006 19/10/2006 |
100% |
| Marche Multiservizi | Multi-utility | 23/07/2007 | 41.8% |
| Aspes | Multi-utility | 28/06/2007 27/07/2006 |
49.8% |
| Enel electricity distribution grid in Modena | Electricity distribution | 27/06/2006 13/03/2006 |
100% |
| Geat Distribuzione Gas | Gas distribution | 29/06/2006 | 100% |
| Meta SpA | Multi-utility | 24/06/2005 Analyst presentation |
100% |
| Ecologia Ambiente | WTE | 06/07/2004 Analyst presentation |
100% |
| SET | CCGT | 15/12/2004 | 39.0% |
| Calenia Energia | CCGT | 28/09/2004 | 15.0% |
| Agea SpA | Multi-utility | 27/07/2004 Analyst presentation |
100% |
| YEAR | DISMISSION/ CLOSED |
MERGER/ DE-MERGER |
ACQUISITIONS/ ESTABILISHMENT |
CONFERMENT | TRANSFORMATIONS | TOTAL |
|---|---|---|---|---|---|---|
| 2023 | 0 | 7 | 5 | 0 | 0 | 12 |
| 2022 | 4 | 4 | 3 | 0 | 0 | 11 |
| 2021 | 2 | 1 | 9 | 0 | 0 | 12 |
| 2020 | 8 | 1 | 5 | 0 | 0 | 14 |
| 2019 | 8 | 1 | 5 | 0 | 0 | 14 |
| 2018 | 2 | 5 | 5 | 0 | 0 | 12 |
| 2017 | 8 | 2 | 10 | 0 | 0 | 20 |
| 2016 | 5 | 4 | 4 | 0 | 2 | 15 |
| 2015 | 9 | 8 | 9 | 0 | 2 | 28 |
| 2014 | 5 | 7 | 8 | 2 | - | 22 |
| 2013 | 12 | 4 | 11 | - | - | 27 |
| 2012 | 9 | 2 | 2 | - | 1 | 14 |
| 2011 | 9 | 2 | 2 | - | 1 | 14 |
| 2010 | 3 | 3 | 4 | 3 | 13 | |
| 2009 | 11 | 12 | 8 | 4 | 35 | |
| 2008 | 6 | 1 | 7 | 1 | 15 | |
| 2007 | 6 | 2 | 6 | 3 | 17 | |
| 2006 | 24 | 3 | 7 | 3 | 37 | |
| 2005 | 23 | 3 | 18 | 2 | 46 | |
| 2004 | 14 | 4 | 29 | 0 | 47 | |
| 2003 | 26 | 4 | 11 | 0 | 41 |