FY2023 Results
The results of a multi-business strategy and long-term value creation, rising to tomorrow’s challenges today


Online report FY2023
FY2023 Results
The results of a multi-business strategy and long-term value creation, rising to tomorrow’s challenges today

"We closed 2023 with record performance in our main operating and financial indicators, achieved within a macroeconomic environment that was volatile and uncertain. Ebitda reached almost 1.5 billion, net profit attributable to shareholders grew by 16.5% and investments were up by 15%, exceeding 800 million euro."

"In 2023, Ebitda exceed the targets set in the previous Plan to 2026 three years ahead of schedule. The normalisation of energy prices made it possible to reduce net working capital achieving a significant financial structure and a Net debt / Ebitda ratio of 2.56x."
“We closed 2023 with record performance in our main operating and financial indicators, achieved within a macroeconomic environment that was volatile and uncertain. Ebitda reached almost 1.5 billion, net profit attributable to shareholders grew by 16.5% and investments were up by 15%, exceeding 800 million euro. As a result, the economic value distributed to stakeholders in the areas in which we operate reached 2.3 billion euro, up 36%. We achieved these results mainly thanks to the contribution coming from the waste management and energy areas. In the energy area in particular, we achieved significant growth supported by commercial development, last resort markets and energy efficiency services. At the same time, debt fell by 10%, bringing us to a Net debt / Ebitda ratio of 2.56x, allowing the Board of Directors to propose a 12% increase in dividends, equal to 14 eurocents per share. The 2023 results thus confirm the validity of our Group’s strategic vision and constitute the solid building block of our new business plan, approved in January.”
Cristian Fabbri
Executive Chairman
“In 2023, Ebitda exceed the targets set in the previous Plan to 2026 three years ahead of schedule. The normalisation of energy prices made it possible to reduce net working capital achieving a significant financial structure and a Net debt / Ebitda ratio of 2.56x. The Group thus regained its usual financial flexibility and can continue to seize further growth opportunities in its reference markets, still highly fragmented. Evidence of this lies in the transactions carried out in 2023, which also confirm our focus on generating sustainable growth in the local areas served. This commitment was confirmed by the increase in both shared-value Ebitda, up by 16% to 776.0 million euro, 52% of overall Ebitda, and in CSV investments, which amounted to 558.4 million euro in 2023, approximately 69% of total investments. Finally, we proved our ongoing commitment to sustainable finance, a driving force for our investment plan and confirmation of our desire to create value in the areas served, with particular attention going to objectives including decarbonisation, circular economy, innovation and resilience, consistent with our corporate purpose and the path set out by the Business Plan.”
Orazio Iacono
CEO


| M/€ | 2022 | |
|---|---|---|
| Revenues | 20,082.0 | |
| EBITDA | 1,295.0 | |
| Net income | 322.2 | |
| Investments | 688.7 | Net Debt/EBITDA | 3.28 |

| M/€ | 2023 | |
|---|---|---|
| Revenues | 14,897.3 | - |
| EBITDA | 1,494.7 | + |
| Net income | 375.2 | + |
| Investments | 779.2 | + |
| Net Debt/EBITDA | 2.56 | - |


| Consensus | Hera's results | Δ % | |
|---|---|---|---|
| Ebitda (mln €) | 1,483.8 | 1,494.7 | +0.7% |
| Ebit (mln €) | 779.6 | 741.0 | (5.0%) |
| Net profit post min. (mln €) | 391.3 | 375.2 | (4.1%) |
| Net Financial Position (mln €) | 3,915.6 | 3,827.7 | (2.2%) |
| Preview | Post Results | ||||
|---|---|---|---|---|---|
| Analyst | Broker | Rating | Target Price (€) | Rating | Target Price (€) |
| Francesco Sala | Banca Akros | Buy | 3.80 | Buy | 3.80 |
| Davide Candela | Banca Intesa Sanpaolo | Buy | 3.70 | Buy | 3.70 |
| Roberto Letizia | Equita SIM | Hold | 3.50 | Hold | 3.50 |
| Federico Pezzetti | Intermonte | Outperform | 3.60 | Outperform | 3.80 |
| Emanuele Oggioni | Kepler Cheuvreux | Buy | 3.90 | Buy | 3.90 |
| Javier Suarez | Mediobanca | Outperform | 4,30 | Outperform | 4.30 |
| Average | 3.80 | Average | 3.83 | ||
| Broker | Analysts' comments on financial results |
|---|---|
| Banca Akros | "The company’s results were good and slightly higher than expected at the adjusted Ebitda level. As regards the 2023 results, a stronger than expected performance in the electricity business more than offset a weaker gas segment. Dividend is consistent with what was announced last January when presenting the Business Plan to 2027 in which Hera is targeting further Ebitda growth, from 1,295 to 1,650 m€, a >7% Cagr in EPS and steady leverage. The results were good and further growth is expected in the next few years. Recommendation and target confirmed." |
| Intesa Sanpaolo | "Hera’s FY2023 results didn’t bring major surprises, coming in line with our consensus assumptions, despite some differences in few items (provisions, tax rate). We see messages provided by management on the outlook (with particular attention to energy supply operations) and working capital evolution as supportive and reassuring. While we plan to marginally fine-tune our estimates, we believe there is limited room for the consensus to move. We confirm our positive stance on the stock due to Hera’s low-risk profile, balance sheet flexibility/headroom, earnings’ visibility and growth expectations in energy supply." |
| Equita Sim | "Results broadly in line with expectations for Hera, with strong operational growth (+15.4% Ebitda and +16.5% Profit) and significant debt reduction thanks to working capital recovery. In our view, the catalyst for the results is the significant contraction of Group debt, with working capital performance also showing positive signs in the first quarter of the year and with the possibility therefore to sustain investments, M&A and dividends. Hera trades at 11.1x PE and 5.9x EV/Ebitda on 2026E with a yield of 4.7% and a Debt/Ebitda of 2.7x." |
| Intermonte | "We continue to believe that the Group is well placed to benefit from its leadership in the Waste business, further growth in its retail customer base and a strategy built around the concepts of resilience and environmental and digital transition. Moreover, regaining its usual financial flexibility (1.5 bn€ firepower for further market expansion) enables Hera to continue to seize opportunities for growth in its core markets, which are still highly fragmented. We are marginally increasing our 2024-2026 estimates (average EPS +4%) on the back of stronger results at the Electricity division. The Group is trading at 5.9x 2024E EV/Ebitda, a multiple broadly in line with the sector average. Outperform confirmed; Target price at €3.80 (from €3.60)." |
| Kepler Cheuvreux | "Hera recorded strong results in 2023, a record year, almost in line with preliminary figures and our forecast, apart from net profit, due to c. 50 m€ higher provisions, which were related to generic risks for the future. We think this is a positive sign, as we assume management has saved something for a rainy day. We welcome this positive set of results for 2023 and the visibility as to the growth for 2024 onwards. We confirm our Buy rating and target price €3.90. The stock is trading at appealing multiples (6x EV/Ebitda 2024/25E and c. 11x P/E), lower than its historical average (c. 7x EV/Ebitda and c. 15x P/E)." |
| Mediobanca | "2023 Adj. Ebitda was solid & in line with our expectations, being up +15%, showing solid growth in waste (mainly due to treatment business) and electricity supply (thanks to contract re-negotiation and normalization in margins & new safeguarded clients). Growth at bottom line was at +17%, although lower than expectations on higher provisions. Net Debt/Ebitda at <2.6x is solid as well. We update our model to include the final ’23 numbers, with a negligible impact on our forecasts. Therefore, we maintain our €4.30/share and Target Price unchanged. Outperform." |
Hera stock closed the year with an official price of 2.976 euro, up 17.7% year-on-year. This positive performance appeared against a higher average figure for local utilities, which benefited from a positive scenario due to their power generation business, which is not a significant activity within Hera’s portfolio.

In 2023, all main stock markets performed positively, recovering from the heavy losses seen during the previous year, impacted by the energy crisis triggered by the conflict in Ukraine and the end of expansionary monetary policies. Even in a context in which central banks continued the cycle of rate increases to control inflation, investors looked favourably towards both the reduction in energy commodity prices, as the crisis gradually normalised, and the macroeconomic data, which, while pointing towards an economic slowdown, dispelled fears of a deep recession. Indeed, as a reflection of the pandemic period and the more recent Ukrainian conflict, growth continues to be underpinned by expansionary fiscal policies, with investments directed mainly at the energy transition and defence.
Against this backdrop, the Italian FTSE All Share index rose by 26.3% over the period, showing the best performance among the major European stock exchanges, supported by the brilliant performance of banking stocks, whose results benefited from the European Central Bank’s interest rate hike. Hera stock closed the year with an official price of 2.976 euro, up 17.7% year-on-year. This positive performance appeared against a higher average figure for local utilities, which benefited from a positive scenario due to their power generation business, which is not a significant activity within Hera’s portfolio.
Hera’s Board of Directors, which met on 21 March 2023 to approve the year-end results for 2022, decided to propose to the Shareholders Meeting a dividend per share coming to 12.5 cents, up 4.2% and consistent with the indications contained in the business plan. Following the approval of the shareholders, given during the Shareholders Meeting held on 27 April 2023, the ex-dividend date was set at 19 June, with payment on 21 June. Hera thus confirmed its ability to remunerate shareholders thanks to the resilience of its business portfolio, which has enabled it to pay steady and growing dividends since its listing.
The joint effect of continuously remunerating shareholders through dividends and a rise in the price of the stock over the years allowed the total shareholders return accumulated since the IPO to remain consistently positive and to stand at over +280.7% at the end of the reporting period.
The number of financial analysts covering the stock (Banca Akros, Equita Sim, Exane Bnp Paribas, Intermonte, Intesa Sanpaolo, Kepler Cheuvreux and Mediobanca) increased thanks to the coverage by Banca Akros, which gave a positive opinion, and almost unanimously expressed positive opinions, with a target price that continued to show significant potential. At the end of the year, the consensus target price came to 3.49 euro, showing a 17.3% upside potential.

At 31 December 2023, the shareholding breakdown showed its usual stability and balance, with 45.8% of shares belonging to 111 public shareholders located across the areas served and brought together by a stockholders agreement, renewed for three further years and effective from 1 July 2021 to 30 June 2024, and a 54.2% free float. The shareholding structure includes high number of public shareholders (111 municipalities, the largest of which holds shares amounting to less than 10% of the total) and a large number of private institutional and retail shareholders.
Since 2006, Hera has adopted a share buyback program, most recently renewed by the Shareholders Meeting held on 27 April 2023 for a further 18 months, for an overall maximum amount of 240 million euro. The purpose of this program is to finance M&A opportunities involving smaller companies, and smoothing out any abnormal market price fluctuations vis-à-vis those of the main comparable Italian companies. As of 31 December 2023, Hera held 45.8 million treasury shares.
The Group continued to engage in intense communications with financial market players in 2023. After presenting the 2022-2026 business plan, the Group’s top management took part in a road show to meet with investors in the main financial centres and update them on business trends and future prospects. Following the renewal of the Board of Directors, the new management was immediately willing to meet analysts and investors, and participated in important conferences organised by Italian and international brokers. The intensity of the Group’s commitment to dialogue with investors contributes to strengthening its reputation on the markets and constitutes an intangible asset to the benefit of Hera’s stock and stakeholders.
As regards the information required by article 2428, paragraph 3, subparagraphs 3 and 4 of the Italian Civil Code, concerning the number and nominal value of the shares constituting the share capital of Hera Spa, the number and nominal value of the treasury shares held at 31 December 2023, as well as the changes in these shares during 2023, see note 25 of paragraph 3.02.04 and the statement of changes in equity in paragraph 3.01.05 of the Parent Company’s separate financial statements.
Hera makes ongoing efforts to interpret the signs coming from the contexts in which it operates, in an attempt to obtain an overall view of what lies ahead for the Group and its stakeholders. To anticipate future developments, the main drivers of change and their essential interrelations are identified below. In particular, the macro-trends of the Group’s reference contexts are identified, so that its main management policies, which contribute to an industrial strategy consistent with its corporate purpose, can be defined accordingly.
Macroeconomy and finance
The global economic slowdown continued in 2023, prolonging the trend seen during the previous year following the phase of growth recorded in 2021 in the wake of the pandemic. The January 2024 World Economic Outlook Report (WEO Report) published by the International Monetary Fund (IMF) indicates that growth in global gross domestic product (GDP) stood at 3.1% in 2023, down from +3.4% in 2022 and far from the +6.2% seen in 2021.
The foremost cause of this deceleration lies in the restrictive monetary policies adopted by the main central banks, including the Federal Reserve (Fed) and the European Central Bank (ECB), aimed at containing the inflationary pressure induced by the current complex geopolitical situation, above all the conflicts in Ukraine and, more recently, the Middle East, which has furthermore led to phases of slowdown in international trade and a more limited availability of raw materials. In this regard, note that the continuous interest rate hikes introduced by the Fed and the ECB over the last two years, which led the cost of money to settle at 5.5% and 4.5% respectively (compared to under 0.5% in early 2022), brought about a decrease in global inflation, which stood at 6.9% (annual average) in 2023, as against 8.7% in 2022.
The Eurozone, which is the area most strongly affected by the war in Ukraine due to its proximity to the conflict zone and its dependence on gas supplies from Russia, showed a significant slowdown in GDP growth (up by 0.5% in 2023, as against 3.4% in 2022). More specifically, the ECB’s monetary tightening was confirmed in 2023, which helped to bring average European inflation down to 5.4%, as against 8.4% in 2022.
The European Commission’s most recent projections for the next two years point towards a modest economic recovery, due to the impact of geopolitical tensions and the tightening of financing conditions on domestic demand, as well as the household and business confidence index. In 2024, world GDP is expected to grow by 3.1%, with a slight upturn to 3.2% in 2025; estimated growth for the Eurozone is more contained, standing at 0.8% and 1.5% in 2024 and 2025 respectively.
The WEO Report does not foresee additional rises in interest rates, which should remain at their current restrictive levels until mid-2024 and then possibly decline gradually. World inflation is expected to keep declining and settle at 5.8% in 2024 and 4.4% in 2025; similarly, Eurozone inflation is expected to fall to 2.3% in 2024 and 2% in 2025.
At the national level as well, the Bank of Italy’s analyses portray an economy affected by weak international trade and rigid credit conditions, but also partially bolstered by the implementation of the investments contained in the National Recovery and Resilience Plan (NRRP). In 2023, Italian GDP grew by +0.9%, while the average annual inflation decreased to 5.7%, compared to 8.1% in 2022, allowing for a gradual recovery in household purchasing power.
ISTAT’s most recent estimates indicate that domestic demand was mainly driven by private consumption (+1.4% in 2023 compared to 2022), supported by the deceleration in inflation, a gradual (albeit partial) recovery in wages and a higher employment rate. Indeed, the employment rate in Italy stood at 61.8% in November 2023 (+2.2% over the same period during the previous year), with the unemployment rate falling to 7.6%, the lowest level recorded in the last 20 years. These factors contributed to a significantly stronger Italian consumer confidence rate over the past year, following the sharp decline seen in the first three quarters of 2022.
The European Commission’s latest forecasts point towards a growth rate for the Italian economy in 2024 similar to that of the previous year, and an estimated 1.2% increase for 2025. Expectations for Italian inflation indicate a gradual descent, from 1.9% in 2024 to 1.7% in the following two years, due to the effect of the ECB’s restrictive monetary policies, the slowdown in import prices and the fall in the prices of energy goods.
In 2023, stock and bond markets recovered most of the losses accumulated in 2022. Despite the tension in the banking system that appeared in March, most markets rebounded strongly from their lows of the previous year, with some sectors (IT and communications services above all) leading this recovery. Fears of a recession subsided, leading to a normalisation of investor positioning and lower price volatility. The higher awareness shown by investors, gained after the extraordinary events seen in recent years, was a positive factor for markets, which were more prepared to manage risks in advance and not be taken by surprise. This year, the foremost factors influencing financial markets consisted of the main central banks’ monetary policy outlook and its potential effects on economic growth and inflation. Much of the rise in prices in the latter part of the year, in fact, was generated by the growing belief shown by traders that central banks are now close to containing the inflationary trend that has influenced the world economy since 2021. The positive data concerning inflation, as outlined above, led to forecasts of a future reduction in interest rates in both macro-areas (Eurozone and the United States), which not only pushed up stock markets, but also sharply narrowed corporate spreads and bond yields.
In the Eurozone, the ECB confirmed its restrictive monetary policy, which started in July last year, introducing further interest rate increases until September, which brought the reference refinancing rate to 4.50%. However, this upward trend was interrupted in October 2023, when the ECB decided to stop the trend of rising interest rates. This decision was maintained over the following months, consistently with market analysts’ expectations. A similar choice was made earlier by the Fed in June, after ten consecutive hikes, and by the British Central Bank in August. Even though overall expectations are for a rate cut in 2024, central banks still consider it premature to move in this direction until there is evidence that the decline in inflation has stabilised. Indeed, it has been stated that a ‘data-dependent’ approach will continue to be pursued, to determine the most appropriate degree of restrictive monetary policy. In particular, interest rate decisions will be based on an assessment of the inflation outlook in light of operating and financial data, trends in core inflation and the transmission strength of monetary policies themselves. As regards the other monetary policy measures implemented to stabilise the system, the ECB gradually reduced its volumes of security repurchases under the Asset Purchase Programme and the Pandemic Emergency Purchase Programme, and confirmed at its latest meetings its intention to permanently discontinue security reinvestments at the end of 2024. Given that 95% of the repurchases involve government bonds, it is assumed that the end of the programme will not impact corporate bond spreads.

The interest rate curve for the Eurozone, at the end of the year, showed higher levels on the short-term section, peaking at 3.9%, and a linear trend on the medium- to long-term swap rates, remaining at roughly 2.5%. Compared to the previous year, this curve showed an unusual, inverted trend, with the short-term maturity section (one-six months) up by an average of about 164 basis points compared to December 2022, and the medium-long-term maturity section (two-twelve years) down by an average of about 75 basis points compared to the previous year.
In December, the one-year forward scenario showed an expectation for rates to fall by about 150 basis points on Euribor rates and about 30 basis points on swap rates, with levels increasing by maturity from 2.1% (two-four years) to 2.4% (nine-twelve years).

While the interruption of corporate bond purchases on the secondary market by the ECB did lead to a general increase in the spreads applied to companies, Hera’s spread did not suffer this impact. On the contrary, it decreased year-on-year by 24 basis points, thanks both to the recovery seen in the utility sector and the Group’s confirmed solidity and creditworthiness.
The Italian government bond spread decreased year-on-year by approximately 46 basis points, reaching roughly 160 basis points at the end of the year. Over the course of the year, it saw increases bringing it to around 190 basis points, but did not reach the previous year’s peak of over 200 basis points, thanks to an improved default risk view and Moody’s confirmation of the sovereign rating in October.
The differential between Hera’s spread and the sovereign spread in December fell by 22 bps year-on-year, going from 82 bps to 60 bps, with the yield on ten-year Italian government bonds settling at roughly 3.7% and the yield on ten-year German bonds at approximately 2%.

Businesses and regulations
At European level, 2023 saw a significant reduction in gas consumption, due to a range of factors, including above-average temperatures in the winter months, an increase in renewable electricity generation and higher consumer sensitivity to limiting consumption, following the tensions on the supply market related to the Russia-Ukraine conflict. Over the last year, Italy recorded a drop in gas consumption coming to -8%, stabilising at 63 billion cubic metres (preliminary estimate provided by the Energy Market Manager). Note in particular the 55.6% decrease in gas imports from Russia compared to the previous year as a result of the diversification of gas supplies aimed at freeing the EU from its dependence on Russian gas.
As regards electricity, the data released by the national transmission company (Terna) indicates a 2.8% drop in consumption for 2023, with national consumption coming to 306 TWh. At the same time, national renewable energy generation increased significantly (15.4% over the previous year), covering 36.8% of total energy consumption (compared to 31% in 2022), thanks to a positive contribution coming from all sources.
In the waste management sector, the latest data processed by the Institute for Environmental Protection and Research (Ispra, Municipal Waste Report 2023) indicate that nationwide production of municipal waste in Italy in 2022 amounted to 29.1 million tonnes, showing a 544 thousand ton decrease compared to 2021 (-1.8%), with 494 kg of waste produced per capita. Sorted waste collection improved, reaching 65.2%, up by 1.2 percentage points compared to 2021.
As far as the water business is concerned, the sector is facing numerous and increasing challenges concerning the quantity and quality of this resource, as well as infrastructural modernisation and efficiency. The negative effects produced by climate change, including the higher frequency and degree of drought, highlight the need for a strong commitment to investments in this sector.
In the energy sector, a further increase in competitive pressure was seen, resulting from the gradual elimination of the protected supply system. In 2022, the switching rate (change of supplier) for household customers increased by 2.2% compared to the previous year (ARERA, Annual Report 2023). As in previous years, the Italian electricity and gas markets confirmed a widespread inclination to switching suppliers shown by household consumers, eager to seize opportunities to acquire more advantageous options in terms of tariffs and services.
In recent years, this competition has not only concerned the commodity component, but also involves value-added services (VAS), which operators must enhance in order to build portfolios of sales offers that reflect the needs expressed by customers, who are increasingly oriented towards sustainable and energy-saving solutions.
In the waste treatment and recovery sector, the main operators confirmed their interest in acquiring specialised companies equipped with plants and skills on the market. A similar trend concerned the growing attention shown by companies, including medium-sized ones, towards sustainability and improved environmental performance.
As regards regulated businesses, competition involves the procedures for awarding service concessions and their subsequent management.
Turning to legislative and regulatory factors, the most important aspects for the Group in 2023 include:
During 2023, the government took several steps to define the modalities for eliminating the protected electricity service. The Ministry of the Environment and Energy Security (MASE), indeed, approved regulations for the criteria and modalities for the informed transfer of household customers into the free electricity market (Ministerial Decree No. 169 of 18 May 2023). This decree establishes that non-vulnerable household customers will be transferred to the gradual protection service through a system based on auctions, and set the maximum amount of regional areas that can be allocated to each operator at 30%, also requiring household customers, who at the end of the gradual protection service have not autonomously chosen a vendor on the free market, to be supplied by the exiting service vendor at the most convenient market offer.
Acting on the regulations defined by the aforementioned decree, ARERA, with Resolution 362/2023/R/eel, provided indications for the transition to the gradual protection service (STG) for non-vulnerable household customers who, at the time of the elimination of the protected service, have not yet chosen a vendor on the free market. The gradual protection service (STG) guarantees continuity of supply to customers and will have a limited duration, coming to three years (from 1 July 2024 to 31 March 2027). The price applied to STG end customers will be the same throughout the country, with an equalisation system for vendors. Contractual conditions similar to those of Placet offers will be applied. In January 2024, auctions were held with a single, closed envelope, in a simultaneous round system for all areas to select the operators to supply the STG to non-vulnerable customers
The elimination of the protected gas service, which also took effect on 10 January 2024, was instead governed by the “Help-bis” decree (Legislative Decree No. 115 of 9 August 2022), which does not provide for allocating customers through tenders, but through a modulation of suitable sales projections by the vendors who served these customers under the protected system. ARERA implemented the content of the aforementioned decree with resolution No. 100/2023/R/com; more specifically, this resolution sets out both the procedures for eliminating the protected gas service and an identification of the criteria for vulnerable customers. Provisions were also introduced concerning the information obligations of vendors towards end customers regarding the elimination of the service and the rights of vulnerable customers. Finally, changes were made to the gas Code of Conduct and the Offers Portal, following the elimination of price protection.
Other measures concerning competitive procedures were introduced by the Energy-bis decree (Law No. 11/2024 converting Decree-Law No. 181/2023), which set out the modalities for assigning the electricity supply service to vulnerable customers. Operators will be identified through competitive procedures and the procurement of wholesale electricity will be entrusted to the Single Purchaser. In addition, the same decree, again with reference to the electricity sector, established that, as of 1 January 2025, all electricity customers will no longer be charged prices indexed to the Single national price (PUN), but will be charged zonal prices defined based on trends in the wholesale electricity market, whose implementation criteria have been requested from the MASE and ARERA. Finally, note that as part of the definition of the rules for reinforcing the security of natural gas supplies, this decree introduced a sort of penalty for operators who do not reach the amount of energy savings they committed to in the tender for awarding the natural gas distribution service.
Measures were also taken by the government and the national regulator during 2023 to deal with the flooding events that occurred in the Emilia-Romagna region and other neighbouring areas.
Firstly, with resolution 216/2023/R/com and as of 1 May 2023, ARERA called for the suspension of the terms of payment of invoices issued or to be issued, and the non-application of the rules for suspension in case of arrears, with reference to electricity, gas and water supply as well as the integrated municipal waste cycle. Subsequently, the government, with the so-called Flood decree (Decree-Law No. 61 of 1 June 2023), identified the local area covered by the payment suspensions terms defined by ARERA, requiring the latter to regulate the timing and the length of the suspension of bill payments, in any case for a period not exceeding six months. ARERA then introduced further measures, which set at four months the period of validity for the suspension of bill payments and payment notices previously determined by the Regulator, clarifying that it was possible to extend this period up to a maximum of six months. Lastly, in late 2023, with resolution 565/2023/R/com, ARERA identified, in a more cohesive manner, the tariff concessions in favour of the residents most affected by the flooding events; these measures were subsequently confirmed by resolution 10/2024/R/com, which supplemented them by making certain changes, partially with a view to reducing the overall charges imposed on operators and managers.
Lastly, among the more important regulatory interventions, note the law converting the so-called Bills decree (Law No. 56/2023 converting Decree-Law No. 34/2023), which enlarged the customer base that may benefit from the social bonus for electricity and gas and confirmed the reduction of general charges in the gas sector for the second quarter of 2023, as well as the tax credit for companies for purchasing electricity and natural gas. The Bills decree also extended, for 2023, the application of reduced VAT rates on the consumption of methane gas for civil and industrial use. Note, however, that the 2024 Budget (Law No. 213/2023) does not provide for the renewal of these tax breaks, and establishes that, as of 1 January 2024, the VAT rates would be brought back to their ordinary amounts.
Moving on to an examination of the most relevant measures for the energy infrastructure sectors, note that, following a long consultation process that began in 2021, in early 2023 ARERA approved, with Resolution 163/2023/R/com, the Integrated Text of the Criteria and General Principles of the Regulation by expenditure and service targets (ROSS) for 2024-2031 (TIROSS 2024-2031). This text is currently made up of general indications (Part I) and general guidelines for the ROSS method in its basic content (Part II). The completed TIROSS will include a Part III, dedicated to the complete ROSS. The objective of the new regulation is to direct resources efficiently, eliminating the distortions created by the current regulatory instruments concerning the investment choices made by companies. The path towards the new method will begin with a simplified version, called basic ROSS, which will be applied as of 2024 to electricity distribution operators and as of 2026 to gas distribution companies. With regard to the criteria for determining the recognised cost following the basic ROSS approach, ARERA has established that the actual (total) expenditure of distributors will be compared annually with a reference expenditure defined by the Regulator (the so-called baseline). Furthermore, each distributor will be able to choose how to share any efficiencies/inefficiencies achieved with users, choosing between the two options of the incentive menu introduced by ARERA (low incentive potential and high incentive potential). ARERA has also defined the speed of tariff release by introducing a regulatory capitalisation rate that allows eligible expenditure to be divided into two portions: slow money, representing capital costs, and fast money, representing operating costs. Lastly, note that the tariff treatment of capital stock existing at the date of transition to the new methodology will be implemented with continuity in the criteria applied.
The criteria with which the basic ROSS is applied specifically to the electricity distribution service were approved with resolution 497/2023/R/com, with which ARERA established that the new basic ROSS method will be applied to all electricity distributors serving at least 25 thousand PoDs and will include all types of operator costs, with the sole exclusion of capital costs pertaining to 2G smart metering systems. The most important change introduced by the resolution concerns the quantification of the operating cost baseline, which will be differentiated for each company on the basis of the amount of its actual costs as resulting from the Separate Annual Accounts (CAS) of the test year, 2022. Furthermore, it established that the total efficiency recovery will be fully allocated to operations management, meaning that the expenditure eligible for tariff recognition will be the sum of the total actual expenditure and the efficiency incentives allocated to operations management. Lastly, note that ARERA will take into account the inflation update that is actually aligned with the scope of capital and operating costs included in the tariff year, and the regulatory capitalisation rate will be differentiated by company based on their historical trend.
Once again regarding electricity regulations, note provision 617/2023/R/eel, which defines the regulation of the technical (TIQD) and commercial (TIQC) quality of the electricity distribution and metering service for 2024-2027. More specifically, with the TIQD ARERA has introduced a complementary rationale with respect to the ROSS tariff method, overcoming the approach to regulation, output-based until present, based on national service quality standards and introducing customised objectives, based on the historical performance of each distributor, with the intention of reflecting the regional contexts in which companies operate. With regard to the new integrated text for commercial quality (TIQC), instead, there is no change in the perimeter of the services subject to standards, but only a 15% increase in the value of the automatic compensation to be paid to users in cases of non-compliance with the maximum time limits for carrying out interventions.
During 2023, the Milan Regional administrative court (TAR) published a number of rulings on the administrative appeals made by various operators against Resolution 570/2019/R/gas, related to the updates for the fifth regulatory tariff period (2020-25) for gas distribution. Among the grounds for the appeals upheld by the administrative judges, the main reason concerns the recognition of operating costs, on which the Milan TAR found that ARERA had failed to carry out a preliminary investigation during the consultation phase, and that the tariff method established was illegitimate, since it did not reflect the differences in companies’ cost structure and could not account for the impact on these costs deriving from environmental shocks or from regional elements in prices for production factors. The content of the published sentences cannot be directly interpreted as regards its effects, for reasons including ARERA’s decision to appeal to the State Council (CdS). The ruling on the appeal made by the Group company Inrete Distribuzione Energia has not yet been published.
In execution of these rulings, ARERA has appealed to the State Council, which rejected the Authority’s appeal, confirming the inadequacy of the tariff method with respect to recognised operating costs. The State Council also generically limited itself to ordering that the rulings be enforced according to the motivational assumptions indicated, even though it is well known that the effects will necessarily be erga omnes (at least for the cluster of large operators).
With reference to both the electricity and gas sectors, note that ARERA, with Resolution 556/2023/R/com, revised upwards the rates of return on invested capital for infrastructure services in the electricity and gas sectors for 2024. WACC for electricity distribution will increase from the current 5.2% to 6.0%, and WACC for gas distribution will increase from the current 5.6% to 6.5%. This increase is mainly due to the rise in the Stable Countries’ rates of return and the spread seen during 2023.
As regards the regulation of the district heating service, note that ARERA, after a lengthy consultation process, in late 2023 and with resolution 638/2023/R/tlr approved the district heating tariff method for the transitional period from 1 January to 31 December 2024 (Mtl-T). This measure established for the transitional period (defined as the 2024 calendar year) a tariff regulation based on the avoided cost method, introducing, however, a number of significant additions to what is currently in use among operators. More specifically, ARERA required operators to respect a revenue cap, which in any case leaves them the possibility of defining the scope of application of the tariffs. The revenue cap is determined as the overall sum of the avoided costs per unit (euro/MWh) for the quantities of heat supplied (MWh) with reference going to the various networks, to each month of the year and to each category of user. With this measure, ARERA accepted the request to include the safeguarding clause, formulating it in such a way as to limit to 10% the contraction in revenue resulting from the new tariff methodology, for the systems managed as a whole. Each operator therefore has the option of applying, instead of the revenue cap as ordinarily calculated, an annual safeguard restriction set at 90% of the revenues calculated by applying the tariff conditions prior to the Authority’s regulation to the scale variables seen in 2024. In defining revenues, a cap must be applied to the production quotas not based on natural gas, set at €36/MWh; this provision essentially takes into account the fuel mixture of each district heating system, so as to ensure greater consistency between costs and revenues in networks characterised by a lower use of natural gas for the production of thermal energy.
As regards the regulation of the integrated water service, the measures introduced in 2023 having the greatest impact for the Group concern the tariff method for the fourth regulatory period (resolution 639/2023/R/idr), which confirmed the previously existing general structure, but extended the period from four to six years (maintaining the updating period at every two years). The resolution includes, among other elements, a valorisation of the most economically impactful indicators such as rates on invested capital and inflation. In particular, the rate defined to cover financial and tax expenses on invested capital was set at 6.13% for the two-year period 2024-25, a sharp rise from the 4.80% recognised up to 2023; this increase, similarly to what was seen in the energy sectors, was determined by the increase in the free-risk rate and the water risk premium recorded in 2023, in addition to an increase in the rate defined to cover the cost of debt, which rose from the current value of 2.4% to 3.0% (in real terms). Also note that the classes of assets subject to tariff recognition are now increased with categories associated with the new technical quality indicator as regards storage of the resource and management of rainwater (water resilience). For endogenous operating costs, the reuse of the efficiency mechanism for the previous period was confirmed, with an incremental effect and based on the retrocession of quotas (differentiated according to the behaviour and costs sustained by the various operators) of the margin recognised, for these costs, in 2020. Concerning the recognition of electricity costs, starting from the costs accrued in 2024 (and therefore applied to the 2026 adjustment), the previously hypothesised benchmark was introduced based on a “theoretical” mix of variable-price and fixed-price procurement costs (whose respective weights, for 2024, were set at 70% and 30%), valued based on the operators’ final cost data in both instances. This benchmark, increased by a 15% allowance, constitutes the new cap for the recognition of costs in the event of an actual cost that is higher than the benchmark, while if the actual cost is lower, the same actual cost will be recognised in addition to 50% of the efficiency achieved with respect to the amount of the benchmark itself (sharing).
In late 2023, regulations for the technical quality of the integrated water service were also updated by resolution 637/2023/R/idr. The innovations introduced include: the new macro-indicator M0 on the resilience of the water system, aimed at monitoring the effectiveness of the supply system in satisfying water demand, numerous clarifications related to the construction of the previously existing macro-indicators as well as changes in the calculation of some macro-indicators, and a cumulative two-yearly assessment of the targets achieved (the latter now also concerning contractual quality).
With regard to regulations for the municipal waste management service, the measures finalised by ARERA in 2023 and having the greatest impact for the Group concern the publication of the standard outline of the service contract for the regulation of relations between the bodies responsible for tenders and operators in the municipal waste service (Resolution 385/2023/R/rif). Compared to the current form of the service contracts in force (which must be updated no later than 30 days after the adoption of the 2024-2025 tariff updates), higher certainty has been established in relations between the parties, particularly with regard to regulatory or contextual changes that will come into effect during the course of the concession.
With consultation document 514/2023/R/rif, the Authority also set out its guidelines for defining a model outline for tender publications for awarding the integrated municipal waste management service. The model aims to ensure greater uniformity in the acts governing public procedures for assigning this service. The organisational structure of this sector is indeed characterised by a strong lack of uniformity nationwide, starting from the large number and disparate nature of the subjects that manage it. The guidelines contained in the consultation text focus, in particular, on the elements of calls for tenders that are able to reflect the technical, economic and industrial peculiarities of the integrated waste management service, and the criteria for determining the basic amount of the tender, for admitting participants and formulating and evaluating the technical and economic offers.
Furthermore, in 2023 ARERA introduced important monitoring and transparency obligations for the efficiency of sorted waste collection and municipal waste treatment plants, set forth in resolution 387/2023/R/ref. These monitoring obligations, whose results must be communicated periodically to ARERA, are based on indicators broken down into the categories of efficiency and quality of sorted waste collection, efficiency of residue management, continuity of the treatment service and commercial quality of the entire chain.
Concerning tariffs, resolution 389/2023/R/rif defines the rules and procedures for the two-year update (2024-2025) of the reference tariff revenues and access tariffs for “minimum facilities”, introducing a series of adjustments to the MTR-2 tariff method. One of the most significant is the re-establishment of ARERA’s tariff powers in light of the ruling of the Italian Administrative Court of Justice (sentence 7196/23), which states that the tariff method seems likely to cause distortions in competition for the pre-treatment segment between integrated operators and “stand-alone” plants. ARERA, in order to comply with this ruling, adjusted the tariff method by requiring, among other things, a deduction of costs and revenues involved in the pre-treatment of plastic packaging for the years 2024-2025, and the recovery of costs and revenues for the years 2022-2023. This resolution also revised the inflationary indices for updating the items covering operating costs, setting them at 4.5% for 2023 and 8.8% for 2024. In order to effectively apply these inflationary statistics, ARERA extended the limit on growth and requested the local authority in question to determine the value, up to a maximum of 7%, of the coefficient covering the higher charges for 2022 and 2023, without prejudice to a maximum value of the limit on growth set at 9.6%. Finally, ARERA recognised the possibility of redefining the amounts that exceed the growth limit for the years following the 2022-2025 regulatory period.
During 2023, the State Council issued a number of important rulings. One new sentence (10734/2023) confirmed the principles set out in a previous ruling (00486/2023), repealing Emilia-Romagna’s regional resolutions and all subsequent acts attesting to the qualification of WTEs and landfills as minimum facilities. This sentence follows another one that had declared illegitimate the measures by which the Region provided for authoritative allocations of flows of the organic fraction of municipal solid waste (FORSU) in favour of minimum facilities, due to the presence of a competitive market that does not justify the identification of facilities intended for the end of the municipal waste cycle in this region. It also follows, in its principles, the more recent sentence 00486/2023, which confirmed a ruling by the Lombardy Regional Administrative Court (TAR) concerning the annulment of the resolution that had defined the waste tariff method (MTR-2) for the second regulatory period, 2022-2025, with regard to the part in which it regulates the criteria for defining minimum treatment facilities. The State Council confirmed what the TAR had ruled, arguing that ARERA and the Regions are not qualified to identify facilities as minimum. According to the division of jurisdictions provided for by the Constitution, the national government has jurisdiction over matters of environmental protection and ensuring competition. Therefore, the Regions and ARERA will have to act within the framework of rules to be defined by the national government. Sentence 10734/2023 unequivocally affirms that the previous sentence 00486/2023 (which resulted from an initiative of an operator of the Region of Puglia) must be extended to the decisions made by the Region of Emilia-Romagna, and clarifies that the application of the annulment extends to all acts subsequent to the regional act qualifying WTEs and landfills as minimum facilities.
A timeline showing the main regulatory periods and related measures introduced by ARERA, pertaining to the Group’s sectors of activity, is provided below.
Tariff regulatory periods

*Resolution 614/21 set out the methodology for determining the rates of return on energy capital and established the WACCs for 2022 only; these rates were confirmed for 2023 as well by Resolution 654/22, while Resolution 556/23 updated the WACCs for 2024
Lastly, the table below indicates the main tariff references for each regulated sector, based on the regulatory framework in force in 2023 and expected to remain until the end of the current regulatory periods.
| Natural gas distribution and measurement | Electricity distribution and measurement | Integrated water service | Integrated waste cycle | |
|---|---|---|---|---|
| Regulatory period |
2023-2025 |
2020-2023 2024-2027 |
2022-2023 2024-2029 |
2022-2023 2024-2025 |
| Regulatory governance | Single level (ARERA) | Single level (ARERA) | Dual level (governmental authority, ARERA) | Dual level (regional authority, ARERA) |
| Recognised invested capital for regulatory purposes (RAB) |
Previous cost revised (distribution) Weighted average between actual cost and standard cost (measurement) Parametric recognition (centralised capital) |
Until 2023: As of 2022 As of 2024: |
Previous cost revised | Previous cost revised |
| Regulatory lag for investment recognition | 1 year | 1 year | 2 years | 2 years |
| Return on investment (3) (real, pre-tax) |
2022-2023
|
2022-2023 |
2022-2023 |
2022-2023 (4)
|
| 2024 6.5% |
2024 6.0% |
2024-2025 6.1% +1% for investments as of 2012, covering the regulatory lag |
Anni 2024-2025 (4)
6.3% Collection 6.6% Treatment +1% for investments as of 2018, covering the regulatory lag |
|
| Recognised operating costs |
Average actual costs by company grouping (size/density), based on 2011 (for revenues until 2019) and 2018 (for revenues as of 2020) (5) Sharing for efficiencies achieved against recognised costs Update with price-cap |
Until 2023: Average actual segment cost values on a 2014 basis (for revenues until 2019) and (2018 for revenues from 2020) Sharing for efficiencies achieved against recognised costs Update with price-cap As of 2024 Actual cost for operator + efficiency incentive for operating costs calculated based on a regulatory menu that calls for sharing, with customers, the delta between the average actual cost for the operator based on 2022 (for revenues until 2027), called baseline, and the actual cost paid by the operator during the year |
Efficient costs: operator’s actual 2011 values inflated Updatable costs: actual values with 2-year lag Additional charges for specific purposes (provisional nature) |
Collection and treatment Actual operator costs with 2-year regulatory lag Additional costs for quality improvement and changes in the operator’s scope (provisional) Additional charges for specific purposes (provisional nature) |
| Annual efficiency operating costs |
Annual X-factor As of 2020: Distribution: 3.53% large companies Measurement: 0% Marketing: 1.57% |
Until 2023: Annual X-factor Distribution: 1.3% Measurement: 0.7% As of 2024: Distribution + Measurement: |
Efficiency mechanisms based on: sharing 2016 operator efficiencies Differentiated sharing level with respect to the distance between actual cost and efficient cost of the operator |
|
| Incentive mechanisms |
As of 2024 Z-factor: recognition of extra costs linked to the energy transition Public contribution: recognition of 10% of the amount in three quotas |
Sharing of electricity costs based on energy savings achieved Recognition of 75% of margins from activities aimed at environmental and energy sustainability |
Collection Sharing on revenues from the sale of material and energy (range 0.3-0.6) and from Conai fees
Treatment Sharing not explicitly recognised by the method, although it can be traced back to the general principles supporting the development of the circular economy |
|
| Annual limit on tariff increases |
On an asymmetrical basis and depending on: - investment needs - cost-effectiveness of management - changes in scope of operations
Mechanism to guarantee operating and financial balance |
Collection On an asymmetrical basis and depending on the presence of: - changes in scope of operations - improved service quality
Treatment Limit to growth less tight since the efficiency factor is not provided for, it depending on: - inflationary growth - environmental impact of plants
Collection and treatment Mechanism to guarantee operating and financial balance |
(1) Resolution 616/23 defines the tariff regulation of electricity distribution and metering services for the period 2024-2027 by implementing, for the determination of the recognized cost, the application criteria of the new ROSS regulation (Regulation by Objectives of Expenditure and Service), governed by Resolution 497/23/R/com.
(2) Resolution 363/2021/R/rif updated the previous regulatory period and introduced tariff regulation for treatment where these are “minimum” facilities, i.e. essential for ending the municipal waste cycle.
(3) For the energy and waste sectors, reference is made to the WACC methodology, while for the integrated water service the values refer to the coverage rate of financial and fiscal charges.
(4) For 2022-2025, the reference deliberation for WACC in the waste sector is resolution 68/2022/R/ref. For 2024-2025, the reference deliberation for WACC is resolution 7/2024/R/rif.
(5) In February 2020, Inrete Distribuzione Energia Spa, the Group’s main distributor, along with other operators in the sector, challenged the deliberation before the Lombardy-Milan Regional Administrative Court (TAR) with regard to the significant reduction in the recognition of operating costs introduced by resolution 570/2019.
Climate and the environment
Regulatory and economic interventions aimed at dealing with climate change, and the concrete opportunities that derive from addressing the risks associated with it, have become priorities for international and national institutions, as well as those operating in all economic sectors. The Group’s main concerns in pursuing environmental sustainability coincide with the 17 goals on the 2030 Agenda for Sustainable Development (SDGs), as well as the indications contained in the Paris Agreement to limit global warming to below 2ºC, and the long-term climate strategy “A Clean Planet For All” (adopted by the European Union), intended to achieve carbon neutrality by 2050 and to limit the increase in temperature to below 1.5ºC. Further important elements moving in this direction include the change called for by the Green Deal, the European Commission’s plan for a Europe that is more competitive in the fight against climate change and increasingly capable of transforming the economy and society by setting them on a path of sustainable development and, in the wake of this, the circular economy action plan (CEAP). The actions taken by European and national institutions are coordinated and converge towards the goals of a fair, sustainable and inclusive transition.
Adopting the Green Deal and related initiatives, aimed at tackling climate change and environmental problems in order to achieve carbon neutrality and transition to a regenerative and circular growth model, moves towards an industrial strategy that implements the circular economy in all sectors.
The Circular Economy Action Plan, presented by the Commission in 2020, has made it possible to outline a strategic framework for circular economic development in the European Union and, in so doing, is geared towards accelerating the transition and making the change foreseen by the Green Deal possible.The framework of initiatives incentivising reuse and recyclability of products, a reduction of overpackaging and rules for bioplastics has been rounded off by proposals for new obligations for the prevention, reduction and collection of textile and food waste. Furthermore, the promotion of the circular economy is also encouraged by new water management policies, in terms of both reuse of purified wastewater for irrigation in agriculture and minimum requirements for the use of reclaimed water.
National policies are developing in a European context where priorities are defined and available resources allocated accordingly. In this sense, the National recovery and resilience plan (NRRP), which makes use of the European funds made available by the NextGenerationEU package supplemented by a complementary national fund, guides Italy in the implementation phase of the European Green Deal and, since there is an overall consensus concerning the need to introduce progressively more challenging climate targets, reinforced instruments have been made available to member states with the aim of:
In order to face the energy crisis that began last year, in May 2022 the European Commission introduced a series of measures that can be initiated in the short term (REPowerEU), including a common gas purchasing platform, the promotion of market instruments aimed at making the cost of electricity more independent from short-term market dynamics, a diversification of supply, and a reduction of gas demand through energy efficiency and electrification of consumption. These were complemented in 2023 by proposals for regulations aimed at ensuring a secure and sustainable supply of critical raw materials and reducing the EU’s dependence on imports, strengthening European supply chains including recycling, and enhancing Europe’s industrial capacity in the production of net-zero technologies.
The drive to decarbonise the European economy has instead been addressed through long-term initiatives, in particular the Fit for 55 package, which foresees a series of measures (some of which have already reached the end of the approval process with a positive outcome) aimed at reducing climate-changing emissions by 55% by 2030, focusing on an increase in renewable energies in the production mix. In terms of energy efficiency, the current 2030 targets, revised upwards to meet the ambitious emission reduction target, will be pursued by giving a leading role to public buildings in the process of making Europe’s real estate stock more efficient. In terms of renewable energies, whose increased production is decisive in replacing fossil fuels and reducing carbon intensity, the electrification of consumption will require considerable investments along the entire supply chain. As far as local energy planning is concerned, the recovery of waste heat from industrial processes is expected to offer significant potential for local areas. The development of renewable gases, including hydrogen, by constructing electrolysers powered by renewable energy sources, will also be a priority.
In early 2018, the European Commission published the Sustainable Finance Action Plan, which aimed to reach three objectives: redirecting capital flows towards sustainable investments in order to achieve sustainable and inclusive growth; managing financial risks arising from climate change, resource depletion, environmental degradation and social issues; and promoting transparency and a long-term vision in economic and financial activities.
The first concrete action took the form of the EU’s own definition of a Taxonomy for sustainable investments, aimed at directing investors’ funds towards sustainable initiatives. In order to be aligned with this Taxonomy, economic activities must comply with three principles identified by the Regulation:
Moreover, as of 1 January 2022, companies subject to the directive on non-financial reporting must indicate the amount of their activities that are eligible for the European Taxonomy.
As regards the Italian context, the six strategic missions of the NRRP that are built around the six pillars of intervention set out in the European Regulation for Recovery and Resilience and are accompanied by specific sectoral reforms have been flanked by a new chapter dedicated to the goals of REPowerEU, whose resources will be used to provide support to the production system in bringing about the ecological transition. As regards Mission 2, Green revolution and ecological transition, the largest in terms of allocating resources that concern the Hera Group, the project implementation phase is beginning.
For the water cycle and waste sector, the NRRP aims to modernise networks and plants and reduce the infrastructure gap between the north and south of the country, assigning a central role to the national Plan for the water sector (as regards providing public funding), and to the national Programme for waste management.
In the energy sector, the NRRP focuses on developing renewable energy sources, modernising electricity grids (to increase their digitalisation and resilience against climatic events) and energy-saving solutions. Other key actions include the integrated development of the hydrogen supply chain, promoting production- and consumption-side projects at the same time and the principle of energy efficiency as the first zero-emission fuel.
All countries that signed the Paris agreement made a commitment to a strategy for reducing climate-changing emissions reaching 2050. The strategy will move towards improving knowledge of climate impacts, intensifying climate risk planning and assessment, accelerating adaptation actions and developing resilience to climate change globally. People are becoming increasingly sensitive to environmental and social inclusion issues and are thus driving the increase in demand for green & digital interventions, consistently with EU recommendations on economic recovery and resilience. In order to get various stakeholders and civil society involved in the adoption of sustainable behaviour, the European Commission has created the European Climate Pact. This initiative offers individuals and organisations opportunities to learn about climate change and find solutions, also providing space for individuals to interact and promoting a European climate movement. Organisations can identify their own ambassadors with a focus on gender equality and, in order to support the beginning of concrete actions, the Pact’s platform makes it possible to share experiences, funding opportunities and know-how.
The inevitability of climate change, which has led the European Commission to anticipate its emission reduction targets to 2030, with the hope of achieving full decarbonisation by 2050, is also forcing local authorities to revise their priorities and courses of action. Moreover, the pandemic made it urgent to implement actions to make cities and local programmes more resilient and has increasingly oriented regional policies towards circular economy initiatives, sustainable mobility, carbon neutrality and digitisation. This scenario is increasingly ambitious and offers new opportunities to the utility sector. All types of customers (household, industrial and public administrations) will be called upon to introduce technological improvements that can reduce their energy needs.
Promoting and selling products and services for energy efficiency and supporting the energy efficiency of buildings are some of the initiatives being promoted.
Stakeholders, both financial and non-financial, given that they are increasingly interested in sustainability issues, are therefore also moving towards green financing, which can raise liquidity on the capital market at rates that are potentially lower than the alternatives.
Following a rationale based on value sharing between companies and communities, oriented towards finding solutions benefitting both, ensuring the engagement of the community and individuals is becoming increasingly important. The main megatrends are those built on the UN 2030 Agenda, theoretical references and successful experiences of shared value approaches and new business opportunities.
The new lines of development will continue to include the full exploitation of data (seen as a real corporate asset) and a greater focus on cybersecurity, to protect the company and its data. The speed of change makes it essential to define training plans that enable the corporate population to better manage change (first and foremost digital change). This includes training that may be fragmentary but is still able to provide the necessary continuity (self-development).
Technology and human capital
Digital technological evolution involves a continuous acceleration of some major ICT trends and, in addition to moving beyond the paradigms found in economic and social contexts with increasing speed, it alters entire market segments and social relationship patterns. The rise of artificial intelligence (including the generative branch), robotic process automation, data collection and management (internet of things, data governance and data analytics), as well as cloud-based platforms all favour an increase in the amount of data produced and the speed of its availability, generating further opportunities for companies. Utilities are actors capable of promoting a wider use of innovation thanks to their contribution to digitisation and technological development, giving attention to IT security as well. The internet of things and digital interaction between people (exemplified by the automation of more standardised customer relations through chatbots) favour a continuous and growing flow of data, which allows not only rapid analyses of different situations (real time analytics), but also a more precise definition of the decisions and actions to be taken, often with the support of artificial intelligence, which is becoming more qualitatively efficient every day. In this direction, the EU Commission, adopting the communication “Digital compass for 2030: the European model for the digital decade” has confirmed the path for an ethical digital development in Europe, with clear targets to 2030 benefitting citizens and businesses.
Furthermore, note the increasing regulatory focus on artificial intelligence, as exemplified by the European Union’s AI Act, which aims to immediately adopt regulations for AI providers and users, in order to exploit the great potential of this technology through solutions with risk profiles thoroughly foreseen by the regulatory framework.
The benefits of digitally-aware development have been defined in Italy by the “Strategy for Technological Innovation and Digitisation”, one of whose main challenges is to accelerate the transition to a digital society, prepared to achieve the above-mentioned European targets. This strategy intends to innovate while safeguarding economic, environmental and social sustainability and guaranteeing equal opportunities for participation. Embracing this strategy, in 2023 more than 50% of employees in large Italian companies adopted forms of remote working, working from home at least one day a week. Italy also ranks third in terms of readiness for 5G. Investments in telecommunications, networks, software, automation and other technological infrastructures, which are essential for reaching European targets, must be accompanied by the spread of a culture and training that will enable new technologies, which in turn are oriented towards a sustainable and circular economy, as well as hinging on digitisation and artificial intelligence. The NRRP intends to direct 22% of the available funds towards a major digital acceleration in the country, as a lever to give a decisive boost to the country’s competitiveness. Thanks to their relationship with public administrations and SMEs, utilities play an important role in supporting the digital transformation, in particular through digital services for optimising the yield of production processes, but also through sensors installed for data collection and analysis, without forgetting connected machinery for automatic task performance and predictive maintenance. Examples of this can be found in various applications in the respective businesses, such as data-driven energy management solutions, thanks to connected and smart-sensor-equipped systems and devices inside public buildings, or sensors and smart devices distributed throughout the local area, coordinated and integrated by digital platforms that process the generated big data for resource planning and service optimisation.
The widespread presence of digital technology affects all aspects of business operations, extending the changes to the point of translating into additional and new value-added services. The increase in infrastructural requirements, which continues to drive the demand for investment in connectivity and remote collaboration tools, for utilities focuses on the need for connectivity and security applied to remote working and also multi-channel interaction with the customer, without forgetting the management and sensitisation of infrastructures across the area served. The digitisation process is also fuelled by incremental investments in artificial intelligence and hyper-automation, internet of things and internet of behaviours (IoB), distributed cloud and 5G. Operation technology (OT) or remote management, which had developed over the past few years as a niche area limited to plant effectiveness and with little attention to cybersecurity aspects, requires companies to increase investments in order to reduce system fragility. In this context, it is essential to continue to deploy all available technological skills and resources to increase the level of protection and attention to cybersecurity risks, in order to counter threats and minimise possible consequences. Customers in all sectors, who are increasingly inclined to interact through digital channels, expect real-time responses and uninterrupted service availability, and therefore the advantage goes to the most proactive suppliers in terms of attention to behaviour and optimisation of consumption, but also, increasingly, additional services such as smart houses and e-mobility.
Cloud platforms have made high-performance connectivity available and enabled significant infrastructural economies of scale for an exponential development of technology, optimising the use of time. The availability of processing power also drives the spread of artificial intelligence and robotic process automation applications with integrated artificial intelligence (IRPA), which are useful for making the most appropriate decisions on the actions to be taken. The identification and formalisation of operational processes that combine human and automated activities, balancing them according to the value added to the process, is therefore one of the issues to which all organisations will have to pay particular attention, not only in terms of organisational design, but also from the point of view of training and operational monitoring.
Valorising the human component is also fundamental for achieving balance between technology and people, focusing the organisation of resources on value-added activities, according to a model of intelligent integration, which is not limited to mere cost-efficiency and a rationale of pure replacement, but fits into the broader horizon of the just transition desired by the European Union. The reference context presents new challenges and the current trends are strongly interconnected, requiring an integrated approach to human resource management strategy, that takes into account both macro-transitions and the major emerging changes.
This context, also referred to as a “poly-crisis”, focuses on environmental issues as well as the search for sense, community and inclusion. A structural ageing of the workforce is under way, with rises in unemployment and the NEET (not in education, employment or training) population, as well as an increasing focus on the gender gap and the protection of mental health and individual well-being. This constantly changing socio-cultural ecosystem requires an optimal management of generations (age management), diversity and multiculturalism, in pursuit of greater perceived equity.
These transitions (ecological, energetic and environmental) are having an increasing impact in terms of investments and opportunities, with a consequent increase in effort and skills required in Stem (Science, Technology, Engineering and Mathematics) disciplines. The role of companies in implementing the necessary change management and reskilling programs remains a priority, especially in view of the disruptive impact expected from generative artificial intelligence, from which great benefits and/or some risks are expected, especially in administrative and creative areas.
Purpose provides both a path that guides companies in facing challenging goals and a bond that unites the organisation and orients it towards a project that goes beyond customer satisfaction and shareholder remuneration. Today, more than ever, it is crucial to seek the greatest alignment between an organisation’s purpose and an individual’s purpose. To be competitive, purpose must be given meaning and must be acted on, in order to set people’s engagement in motion and transform it into virtuous behaviour.
To remain competitive, companies must be able to respond quickly to changes in the market environment, anticipating emerging trends and adapting organisational models with a focus on the human capital of the entire ecosystem in question. This change concerns all dimensions of talent attraction and engagement, and involves adopting new and practices that enable business agility. Regulatory and procedural agility also plays a highly significant role in this area, understood as the ability to adopt flexible and rapid solutions with tools that are designed for prescriptive purposes.
Scenario analysis is a methodology for defining useful inputs for strategic plans to increase the effectiveness of the business model over time.
This type of analysis involves a process aimed at testing a strategy’s resilience under different assumptions describing possible future states. For the Hera Group, it is essential to analyse the potential impact, positive or negative, of various economic-financial, business, regulatory, competitive, environmental, technological and human capital scenarios that are different from each other, but equally plausible and internally consistent.
The study of scenarios has also been applied to climate change, in order to understand how physical and transitional climate opportunities and risks may plausibly affect business and its various areas over time.
The Hera Group’s corporate purpose is the essential reference for defining the broadest aspects of its strategy. More specifically, the Group’s path for development to generate value for shareholders and create shared value for its stakeholders is based on five strategic references and an enabling lever:
Pursuing these strategic references will leverage the support offered by innovation and digitalisation, to enhance the evolution of the Group’s activities, thanks to the opportunities offered by the most advanced technologies. The aim is to increase efficiency and quality of the services provided, multiplying opportunities for stakeholder engagement and accelerating the spread of behaviours and skills capable of responding to the challenges of a constantly evolving context.
Macroeconomy and finance
The debt structure towards which the Hera Group is oriented responds to its business needs, not only in terms of the duration of loans, but also interest rate exposure. The Group’s financial strategy, in turn, is aimed at minimising its expenses while maintaining a prudential risk strategy.
The Group’s financial structure is based on an attentive long-term planning of the necessary financial resources, which it carries out by analysing and monitoring cash flows, with a view to maintaining a flexible and efficient financial structure. The average cost of debt, in particular, is constantly monitored, through financial risk management activities, which in order to limit the risk of interest rate fluctuations also involve the use of derivative instruments, and through the evaluation of liability management operations aimed at seizing favourable market opportunities and maintaining a debt repayment profile evenly that is distributed over time.
Whereas the Group’s financial structure currently shows a 96% portion of fixed-rate debt, by the end of the period covered by the current Business plan, in 2027, it is expected that the residual debt will be 59% of the current amount, of which 58% will be fixed-rate and 1% variable-rate. Refinancing for maturing debt has been planned. The Group, in a scenario that still presents high rates and a market that is still uncertain about the future monetary policy decisions to be made by central banks, intends to optimise the cost of debt by taking out, in relation to its residual needs, financing whose type of rate will be defined on the basis of future market conditions and in compliance with the limits of its financial risk policy.
The plan confirms the Group’s will to meet its financial requirements by issuing bonds, including green and/or sustainable bonds, and through subsidised lines of financing (including loans granted by the European Investment Bank), in order to meet its investment needs with further efficiency gains and thus guarantee the implementation of innovative and sustainable projects in the waste management, water and energy sectors. The funding strategy is reflected in the actions included in the business plan for projects to reduce greenhouse gas emissions and increase the amount of recycled plastic.
Most of the Group’s business is concentrated in Italy, and Hera’s rating is thus closely linked to the country’s rating, macroeconomic trends and political scenario. Hera’s actions and strategies remain oriented towards maintaining and improving adequate ratings; its habitual communications with the rating agencies Moody’s and Standard & Poor’s (S&P) have resulted in positive feedback in terms of the solidity and excellent balance of its business portfolio, and in terms of its excellent operating performance, efficient and proactive risk management and resilient creditworthiness indicators. In 2023, Moody’s rating was confirmed at BAA2, with an improvement in the outlook from negative to stable, in line with the sovereign rating’s outlook, updated in November 2023 (since, even though the Group’s operations are recognised as sound and sustainable, a company’s rating cannot be more than 1 notch higher than that of the country in which it operates). S&P’s rating was also confirmed at BBB+ with a stable outlook. The Group’s ratings are one notch higher than the sovereign rating and among the best compared to other Italian and foreign utilities, confirming the significant growth achieved over the years and results that are always in line with multi-year forecasts.
Over the period covered by the plan, the ongoing adoption of sustainable financial reporting best practices will support the Group’s green financing and ratings. Hera has been committed to green funding for some time, since it was the first Italian company to issue a green bond in 2014 and adopted a fully-fledged Green financing framework (GFF) in 2019. In 2022, the Green financing framework was updated and aligned with the latest regulatory changes on sustainability, becoming Taxonomy compliant. In October 2021, Hera published its Sustainability-Linked Financing Framework, updated in December 2023, which includes two environmental indicators and related intermediate and long-term targets. In particular, the first indicator concerns the Group’s greenhouse gas emissions (Scope 1+2+3 from downstream electricity and gas sales), while the second involves the amount of plastics recycled by the Group. As part of this framework, the Group issued two Sustainability-Linked Bonds in 2021 and 2023, expanding its debt portfolio with sustainable funding instruments. Consistent with these guidelines, the recommendations of the Financial Stability Board’s Task Force on Climate-related Financial Disclosures (TCFD) have already been implemented by the Group and include the definition of climate scenarios, climate change-related risks and opportunities, processes for managing these risks, and targets for reducing climate-changing emissions.
In this context, the Group’s presence in the Dow Jones Sustainability Index (DJSI), the first index to track the financial performance of the world’s leading companies in terms of sustainability, bears witness to the validity and credibility of the path undertaken by the Hera Group. Recognitions of this type, in fact, act above all as a stimulus and allow Hera to identify the areas to be developed for further improvement in its performance and, at the same time, to include among its reference investors those who are engaged in socially responsible investing (SRI), a segment that, as mentioned above, is undergoing considerable and continuous expansion.
Business areas and industrial strategy
The Hera Group’s 2023-2027 Business Plan confirms the strategic aspects that reflect its corporate purpose: to generate sustainable value for all stakeholders by implementing projects that balance the company’s growth with the development of the local area, working towards a “just” transition. The framework aims to address the challenges arising from the geopolitical context, in line with EU policies and responding to the specific contingencies of the utility sector, built on the pillars of ecological transition, innovation, cohesion and social development.
The Group has confirmed its commitment to decarbonisation and resource regeneration, to encourage and support the ecological transition in the areas it serves: 60% of total investments over the five-year period will be allocated to initiatives contributing to carbon neutrality and the circular economy.
In order to guarantee service quality and continuity, the Group will continue to invest in the resilience of its networks and plants, to respond to exogenous events with a climatic or cyber origin, including extremely significant ones, by implementing development plans and efficiency measures for local system infrastructures.
Innovation is an enabling factor and a lever with which to accelerate the achievement of the environmental, social and economic-financial goals that the Group has set for itself. This involves the use of cutting-edge technologies and systems to optimise and reorganise processes and assets falling under the various organisational units, and thus supporting the chains in evolving and increasing their respective businesses. The implementation of predictive models, new systems and applications based on artificial intelligence will enable advanced remote monitoring and network management, at the same time guaranteeing service quality and continuity. The Group’s investment plan will allocate over 30% of resources to innovation and digitisation initiatives.
The Group’s strategy in free-market businesses aims to support the growth of the customer base, by promoting the ecological transition for customers and local areas, including through the use of digital tools, by offering integrated solutions.
In the energy sector, the Group offers to act as a partner in the energy transition of its customers, providing a rich portfolio of value-added services (VAS) alongside its sale of commodities, including renewable or energy-saving solutions (photovoltaics and the related storage systems, electric mobility, insulation for buildings), as well as assistance and maintenance services. Hera’s ability to grasp commercial opportunities will bring it to reach 4.3 million energy customers by 2027, partially thanks to the acquisition of 1.1 million customers as a result of the gradual protection service tender, concluded in early 2024.
Hera’s role in the offer of decarbonisation services also includes the technological and environmental sustainability proposals of the Group’s ESCos. Now that the period in which incentives were provided by the 110% SuperEcobonus for condominiums is over, in the coming years increasing attention is expected to be paid to energy requalification offers, in particular for real estate belonging to public administrations, and the use of integrated services, including other market segments.
The commitment to the pursuit of carbon neutrality also involves the Group’s intentions concerning consumption efficiency, relying on projects capable of promoting the production and use of renewable energy vectors. The objective over the period covered by the Plan is to encourage the development of owned photovoltaic plants, favouring plant solutions that do not involve further land consumption, such as the agrivoltaic plants and photovoltaic parks on Group sites.
In the waste treatment and recovery sector, a growing awareness of environmental protection and resource regeneration is what underlies the design and development of new services and state-of-the-art plant solutions.
In particular, in special waste management, the Group intends to expand and diversify its portfolio of treatment services with 360° “global waste” proposals, covering the entire life cycle of waste, in order to ensure the circularity of the system. Furthermore, by leveraging the Group’s market leadership and the operating capacity of the newly acquired A.C.R. di Reggiani Albertino Spa, the Plan calls for the development of new technologies for managing reclamation and decommissioning services for industrial plants, including through the participation in new tenders and the consolidation of partnerships with major operators.
In the plastics recovery market as well, the Group’s strategy calls for the development of new projects, both to expand plant capacity in segments already covered, such as the production of PET and recycled polymers for cosmetics and food use, and in more innovative niche segments. In particular, as regards infrastructures, during the period covered by the Plan, the Modena plant for rigid plastic recovery and the Imola (Bologna) plant for carbon fibre recycling will be activated
Hera’s strategy for regulated businesses will focus on increasing the resilience of all assets under management, thanks to the support provided by digital technologies and the use of predictive maintenance models, as well as a commitment to evolve networks and adapt them to the energy transition.
In electricity distribution, the installation by 2025 of about 450,000 second-generation (2G) electricity meters will allow for a more precise measurement of consumption, as well as remote control and maintenance. To accompany the areas served towards the electrification of consumption, the Group is planning investments to adapt primary and secondary substations and electricity grids to support the ever-increasing demands for connection.
In gas distribution, thanks to approximately 310 thousand NexMeter gas smart meters, patented by Hera in 2019 and able to work with “green gas” mixtures, it will be possible to improve safety functions in the event of leaks or earthquakes and offer customers a greater awareness of their consumption, leading to increased energy savings.
To contribute to decarbonisation and the energy transition by regenerating resources and reducing climate-changing emissions, assets in the gas distribution business will be adapted to accommodate alternative carriers to traditional ones, such as green gases.
During the period covered by the Plan, the Bologna power-to-methane plant will become operative. Connected to one of the area’s main water cycle purification plants, it will use wastewater and electricity from renewable sources to produce biomethane to be fed into the grid and oxygen that, in the future, can be used to increase the plant’s purification capacity and efficiency.
Other assets enabling the ecological transformation of the local areas served include district heating networks, for which the Group plans further developments and investments to maximise the use of heat from renewable sources, by increasing the technical efficiency of the networks (thanks to the interconnection of several systems with each other, such as in the municipalities of Bologna and Forlì), as well as the enhancement of geothermal energy and the development of the Ferrara network.
In the water sector, the challenges raised by climate change make it necessary to prepare for drought with an infrastructural development of the networks, which are entrusted with guaranteeing a quality service and a reliable and sustainable supply, through interventions aimed at resilience and the introduction of technological innovations designed to improve operational efficiency. The objectives involving waste reduction are complemented by those concerning wastewater reuse and sustainable water resource management, thus helping to reduce the effects of the footprint on climate change, while promoting responsible and sustainable behaviour.
In particular, in period covered by the Plan, activities will be carried out to increase the resilience of infrastructures in order to reduce network losses, since district-based interventions will guarantee constant control over portions of the network, able as they are to remotely control and intervene on pressure regulation or detect hidden leaks. To make networks smarter and more efficient, approximately 310,000 smart meters will be installed, to automate the management and maintenance of water resources. Various circular economy initiatives are also planned, both at our customers’ facilities and within the Group’s activities and offices, including the effective optimisation of sewage sludge management and recycling materials from water cycle waste with dedicated plant engineering and innovative tools.
In the area of municipal waste management, the Group has confirmed its commitment to achieving its ambitious recycling targets. This includes increasing the quality and quantity of sorted waste collection, which will increase to 77.7% by 2027, up 10 percentage points from the 67.8% recorded in 2022.
The industrial strategy outlined hereto makes it possible to project growth in the Group’s Ebitda coming to over 350 million euro in 2027 compared to the 2022 figure, reaching a 1,650 million euro target at the end of the period covered by the Plan.
The investment plan amounts to 4.4 billion euro, 48% of which will be reserved for development initiatives and acquisitions. Out of total investments, 55% will be allocated to regulated businesses, while the remaining 45% will help drive growth in free market-based businesses. Alongside the investments financed by the Hera Group over the period covered by the Plan, one must add the social and economic value of the additional works that will be carried out in the local areas served, thanks to the almost 400 million in grants received, equally divided between resources coming from the NRRP and other institutions.
The margins generated during the five years falling under the Plan will make it possible to respect the significant financial commitment required in terms of investments, also allowing the Net debt / Ebitda ratio to be brought back to 2.7x by 2027, confirming the Group’s solidity.
As proof of Hera’s commitment to sustainable growth, shared-value Ebitda is expected to rise to 64% of total Group Ebitda by 2027, reaching more than 1 billion euro (approximately 1,049 million, as against 670 million in 2022), in line with the target set at 70% by 2030.
Lastly, the Plan to 2027 confirms that the Group will approach its 2030 targets concerning carbon neutrality and circular economy, including the ambitious 37% emissions reduction target (compared to 2019, with SBTi validation) and a 150% increase in recycled plastics (compared to 2017 data).
Climate and the environment: sustainable development
Hera’s shared value framework, introduced in 2016, has oriented the Group’s strategy towards growth based on responses to the problems coming from the external context, capable of maximising shared value, both for the company and for the community. The Group’s objective is to create shared value through business activities that are strongly integrated into the socio-economic fabric of the communities served, generate operating margins and respond to the drivers of the Global Agenda, i.e. the calls to action for change indicated by policies at a global, European, national and local level.

The latest revision of this model includes the topics of resilience and adaptation to climate change, drinking water (included within the scope of sustainable management of water resources) and biodiversity. These are issues to which the Group has been committed for years, which complement the other dimensions of Hera’s framework (such as the circular economy and sustainable management of water resources). In 2023 as well, the validity of the initiatives launched by the UN Global Agenda to 2030 was confirmed, responding to the existing megatrends: fragile planet, technological disruption and accelerated urbanisation were considered the most closely linked to Hera’s business, having a direct impact on corporate activities. Hera’s contribution is most significant for seven sustainable development goals on the 2030 Agenda: 6) clean water and sanitation, 7) clean and affordable energy, 9) business, innovation and infrastructure, 11) sustainable cities and communities, 12) responsible consumption and production, 13) combating climate change and 17) partnership for the goals.
The Group’s website ( https://eng.gruppohera.it/group_eng/sustainability) and its Sustainability Report (Sustainable Strategy and Shared Value section) offer further details on the actions that the Group intends to promote by contributing in a broad sense to the 17 Goals of the UN 2030 Agenda. The Group has set itself clear industrial objectives for both 2027 and 2030, to make a significant contribution to achieving carbon neutrality. As mentioned above a spart of the presentation of the industrial strategy, note the strong commitment to reduce carbon dioxide emissions from the industrial chain by 37% within 2030 (compared to 2019), calculated according to Science Based Target references. The most significant contributions to achieving these targets lie in the energy efficiency solutions offered to all types of customers (valorising multi-business assets) in addition to those adopted within the Group, developing projects that promote the production and use of renewable energy vectors, and planning investments for infrastructural network upgrading.
In order to promote a culture linked to these SDGs among the Group’s entire workforce, dedicated training events have been made available on its corporate training platform, concerning the circular economy in particular; the UN Agenda is also included in training for all newly hired employees. The main actions include those aimed at promoting energy efficiency, sustainable management of water resources, the selection of suppliers with qualifications in terms of environmental and social sustainability aspects, the development of employment and new skills, and a broader use of innovation and digitalisation. Awareness of the significance of climate change is considered by the Group to be the first necessary step towards incorporating precise responses to the ensuing risks and opportunities into its corporate strategy, consequently reflecting the effects of these responses in the drafting its multi-year plans.
Among the initiatives identified to grasp the opportunities emerging from an analysis of the hypothetical climate scenarios, the most promising have been included in the business plan to 2027, which also outlines the actions identified as mitigation and in response to the risks. In particular, the Group’s strategy to promote energy efficiency and an energy transition towards carbon neutrality is mainly substantiated by the following actions, briefly outlined in the area of industrial strategy:
The resilience of networks and plants, recycling, sorted waste collection, purification and sewage, and saving water resources are some of the main areas that guide resource regeneration in the various sectors. By way of example, the design and execution phases of engineering works show a significant focus on sustainability issues, reducing the environmental footprint and minimising the use of virgin soil. The construction of new treatment plants is increasingly oriented towards giving value to the organic portion of solid municipal waste. Particular attention is also paid to the plastics recycling market, in terms of increasing the recycling capacity of flexible plastics, as well as the construction of plants for recycling new types of plastics (rigid and carbon fibres). The rationale underlying circularity also involves the Group’s main purchasing processes: Hera’s strategic approach includes an increasing focus on materials or goods that meet the principles of the circular economy and extends the adoption of minimum environmental criteria (MEC) to the definition of product characteristics, not only to components for water connections but also to other standard elements of the networks such as gas and water reducers and sewer lifts.
The Group considers regenerating resources to be a fundamental asset of its system, and thus widely adopts circular economy solutions with medium- and long-term industrial objectives and projects based on defined deadlines, through technological and behavioural solutions. These solutions are geared towards improving volumes and quality of separate waste collection, enabling new plant capacity for the treatment, recovery and recycling of special urban waste, soil regeneration through remediation and decommissioning of industrial plants, reducing internal water consumption through the adoption of water-efficient solutions, and increasing the volumes of wastewater reused by promoting agricultural and industrial initiatives. Actions to increase the resilience of the Group’s activities also include the installation of remote-controlled accessories and sensors in all networks (to ensure remote monitoring and management), the installation of smart meters in each business area, and the implementation of programming and modelling tools based on artificial intelligence to anticipate critical events or optimise maintenance.
To benefit the wider use of circular models, greater attention will also be paid to the various customer engagement tools, so as to use the different communication/dissemination channels according to the features of the various geographical areas, as well as to improve and expand the tools already in place by paying attention to the different types of customers.
The campaign to raise awareness of environmental challenges will continue to involve schoolchildren (environmental education projects), and will be carried out through the main media at a local level (press tour on environmental issues).
Decarbonisation policies reduce dependence on fossil fuels and therefore contribute to guaranteeing the security of the system. The Group’s plant assets also have further potential to seize opportunities related to the development of new renewable energy vectors, such as hydrogen. The Group intends to become involved in the various phases of this chain, and has already launched experimental projects moving in this direction. In the sustainable hydrogen production phase, a circular solution comes from synergies between the electrolytic process and the water purification process, with multiple circular flows of material between the two activities (oxygen as input for purification, and biogas from sewage sludge as material for hydrogen methanation). The Group’s Waste-to-Energy plants will be able to use biogenic electricity (considered renewable) to power electrolysers capable of obtaining hydrogen for industrial customers, mobility or the distribution network. Once again with reference to gas distribution, the second phase of experimentation has been positively concluded on the Group’s assets to assess the optimal blending percentage between methane and hydrogen for the operation of cogeneration assets and plants for industrial and household users. This experimentation, the first of its kind in Italy, involves all operators in the gas supply chain, from transport to manufacturers of technological equipment, up to manufacturers of domestic appliances.
For Hera, the need to guarantee quality and continuity in essential services in such a changing context, subject to increased climate risks, represents a cost, but at the same time an opportunity. The necessary increase in investments to improve the resilience of its assets puts the Group, thanks to its solidity and financial capacity, in an advantageous position compared to smaller competitors, who could face greater difficulties in dealing with such a volume of investments. In addition, reinforcing internal skills, accompanied by growth through external lines and tenders, allows the Group to seize opportunities for development in the most effective way.
In other words, the Group intends to make the most of the opportunities offered by technological evolution and digitalisation in order to extract innovations, operational improvements, cost efficiencies and synergies related to data management, to meet the needs of the local area and stakeholders and take a leading role in providing services and accompanying cities towards new development models, overseeing each technological upgrade by analysing its impacts and mitigating its side effects.
Technology and human capital: innovation
The Group intends to leverage technological advances in the chemical and engineering industries to identify plastic recycling processes that are complementary to mechanical recycling and make the process effective even for less pure and less valuable plastic portions. The same advances make it possible, for example, to experiment with solutions that use excess renewable electricity (otherwise unusable) to split water molecules into hydrogen and oxygen and then convert the result into synthetic methane gas by adding carbon (from CO 2).
Hera has adopted a Group strategy to exploit all available information and to be able to guarantee the quality and exchange of data flows. The principles that have guided the implementation of this strategy involve an organisational approach to data architecture, which is articulated in the organisation of information by domains, development according to a product strategy, on a self-service technology platform and with the adoption of a federated governance model.
The Group’s data strategy model and related guidelines are included in training courses dedicated to individual business units, with the aim of applying the strategic plan at all levels. In order to increase the ability to prepare for anomalous events, the data sources used with the convergence between the management environment (applications) and the industrial environment (Group plants) must be continuously extended. Vulnerability assessment activities on both environments, aimed at preventing attacks on systems and plants, are fundamental; to this end, the model envisages distributed actions and responsibilities, and it will be further strengthened in the period covered by the Plan, through projects aimed at increasing monitoring capacity and the evolution of prevention tools.
In order to consolidate its role in the Italian utility sector, Hera intends to leverage the specialisations it has built up over time, by implementing new analytical methods and developing automation and process digitisation projects. The main pillars for developing the digitisation of the Group’s activities include:
Further developments in digitisation include the definition of a specific training plan dedicated to strengthening employees’ skills in the areas of innovation and sustainability, ongoing data analytics and artificial intelligence projects to support the digitisation of processes in all of the Group’s business areas and, in particular, the areas of circular economy and energy transition, as illustrated below among the human capital development strategies.
Planning the data strategy is increasingly aimed at transforming the Group into a data-driven company, where data-driven decisions, valued as a corporate asset and subject to an ethical and conscientious interpretation, highlight the growing importance of data management and the resources dedicated to protecting it.
The global trend of increasing cyberattacks was also confirmed in 2023. In addition to the effects produced by international geopolitical instability, which increased cyberwar actions involving in particular the energy sector and critical national infrastructures, criminal activities also continued, leading to an increase in cybersecurity incidents in all sectors. To face this external scenario, which was also confirmed by the numerous bulletins issued by the National Cybersecurity Agency, Hera maintained a high level of cybersecurity monitoring alerts in 2023, which also brought about an increase in the management of anomalous events by the Group’s SOC (Security Operation Centre). Cybersecurity improvement initiatives continued in 2023, increasing the coordination between initiatives of individual IT (Information Technology) and OT (Operational Technology) Managers and Group-wide initiatives, and maintaining a balance between the macro-environments relating to technologies, processes and people.
As regards processes, during the year, the Group’s cybersecurity management procedures concerning systems, networks and users were revised and communicated to all IT and OT managers. This revision mainly concerned the cloud area, in addition to other more technical aspects linked to increasingly rapid technological developments including the possibility of adopting passwordless solutions or the use of artificial intelligence in the Group’s IT applications.
The increasingly close relationship between centralised monitoring of IT and OT environments was accompanied by the identification of new sources such as, for example, the agents on smartphones and tablets introduced during the previous year and a new monitoring platform for the Group’s cloud environments. As part of monitoring, vulnerability assessments were carried out during the entire year on the Group’s external surface, i.e. scans were done on all public and exposed IP addresses on the Internet, aimed at identifying vulnerabilities on systems and devices in production, as well as two cybersecurity assessments on industrial plants. In 2023 as well, activities aimed at increasing cybersecurity awareness and culture continued through informational campaigns for the entire corporate population, along with specific interventions for technical roles in the IT and OT fields. Periodic ethical phishing campaigns also continued, involving roughly 7 thousand employees for each campaign and reaching a total of over 70 thousand emails during the year. As regards the activities dedicated to technical roles, instead, incident simulation exercises were carried out using special platforms, capable of simulating the company’s IT environment and enacting, in a protected environment, the actual activities that would have to be implemented in the event of a real incident.
The evolution of technology and digitalisation, which calls for an ongoing development of employees’ skills and consequently needs for training, confirms the Group’s strategic decision to introduce cloud-based platforms to increase individual productivity and as major tools for collaboration, since cooperation between humans and technology requires a continuous evolution of the working methods. With this in mind, process automation projects (virtual factory and digital lab) favour the wider presence of a culture of technological integration, focusing on initiatives for applying artificial intelligence, and generative intelligence in particular, as well as community empowerment through digital workplace tools.
The Group intends to use data to generate value for people and for its business, and this intention is confirmed by the gradual digitisation of human resource management processes and the creation of a reference architecture for integrating the systems and data available, along the lines of prescriptive analytics
In a context where the pace of innovation is progressively increasing, the average age of the working population is rising and there is a need for large-scale professional requalification in a very short amount of time, training is increasingly becoming a strategic asset, not least to compensate for the gap between industrial needs and the education system.
The Hera Group’s Employee value proposition (EVP), intended as a response to this context, therefore aims at developing an agile organisation that encourages continuous learning. Each person is thus a protagonist of growth and participates in creating shared value, within a purpose-driven strategy that is integrated with the evolution of the business. This strategy is therefore aimed at recognising that people play a leading role in personal and collective development, which must be enabled and encouraged by a strong cultural alignment and the development of processes that are increasingly advanced, usable and consistent with the expected objectives.
Five priority actions have been derived from the context and the strategic direction defined by the EVP:
In order to encourage the ethical values and behaviour that represent a distinctive model for the Group, a result-oriented culture is promoted, as are relations between individuals and the broad presence of a purpose-guided leadership. The Group’s programmes for culture and an agile approach to improving performance, thanks to well-rooted trust, responsibility, autonomy and work ethics, are guided by the continuous development of a work-by-objectives culture. As part of the Group’s strategy, it is fundamental to make everyone perceive that their work and sense of belonging are correlated to the company’s overall results and performance. As a consequence, developing a talent attraction strategy guided by the company’s purpose is fundamental. In order to enable everyone to express their potential and accelerate the organisation’s growth, favouring harmony between work and private life and guaranteeing an ethical approach to work, welfare initiatives dedicated to individual physical, psychological and financial wellbeing will continue, in line with the priorities identified by continuously listening to people and with the aim of enhancing their wellbeing.
As regards the digital transition, the Group has introduced a specific training programme, HER@futura, with a focus on digital reputation. As mentioned among the previous development pillars for digitalisation, this will introduce increasingly innovative and customised initiatives to develop digital culture, processes and skills, increasing digital proficiency at all levels of the organisation and integrating aspects of corporate digital responsibility in the execution of projects and business processes.
An integrated approach between the ecological transition and the digital transition will be adopted, to improve the level of Energy and Green transition proficiency, accelerating the implementation of the ecoHERA programme so as to strengthen the widespread and/or specialised skills related to the impact of the energy and environmental transitions on the Group’s business.
An equally important focus will go to knowledge management processes, to create a broader and more innovative know-how related to the transitions, as well as to evolve partnerships and projects with the education system (schools, institutes, universities, business schools, etc.) to promote ecosystem approaches and effectively address transition-related challenges.
In order to go beyond the concept of equality and achieve true equity in treatment, thus recognising individual specificities, the Group will continue to evolve its performance management, with the aim of making dialogue between team leader and team member increasingly effective, orienting it towards accountability regarding measurable objectives and greater delegation and autonomy in the organisation of work-related activities. Human resource management and development processes are designed to preserve the skills and distinctive values built up over time and, while also developing individual talents, regardless of gender and age, seeking innovation in all aspects that can generate added and sustainable value over time. In order to develop people’s unique characteristics, targeted policies and programmes are foreseen to enhance inclusiveness and diversity, oriented at fostering a culture of innovation and continuous improvement. Creating more frequent and immediate moments for listening (e.g. pulse surveys, focus groups, etc.) aimed at grasping the intersectionality of people’s characteristics, developing specific training programmes to recognise and remove bias, promoting a broad language that avoids prejudice and stimulating differentiated and accessible forms of communication are all priorities, to create a work environment that welcomes diversity and encourages everyone to be authentically themselves.
It is no coincidence that, in addition to retaining the Diversity management working group (introduced in 2011), Hera, a signatory of the Utilitalia Pact - Diversity makes the difference, will continue to promote inclusive policies at all levels of its organisation, progressively refining measures to reconcile work-life balance and adopting a merit management system that is not only transparent, but above all neutral with respect to gender, age and cultural diversity, with the use of systems aimed at monitoring progress and internal and external awareness policies. This is proven by the achievement, in 2023, by the Group’s main companies, of gender certification pursuant to the UNI PDR 125 reference practice.
Risk governance
The Hera Group’s organizational structure is designed to uphold management effectiveness and profitability across the entire value chain while at the same time managing any risk exposure arising from its businesses.
Hera’s corporate governance system enables strategies to be handled uniformly and consistently. The Risks Committee is the main policy-making, monitoring and reporting organ for risk management strategies. Additionally, under article seven of the Self-Governance Code, the Controls and Risks Committee oversees the internal auditing system, the efficiency of corporate operations, the reliability of financial reporting and compliance with laws and regulations, as well as the protection of company assets. In order to maximise the consistency of the management strategy, these bodies meet periodically. During 2023, the Risks Committee met four times and the Controls and Risks Committee met six times.
The Group has adopted a three-tier risk defence strategy, appropriately distinguishing between:
The Risks Committee sets the general risk management guidelines, maps and monitors corporate risks, ensures that risk policies are set forth and outlines the information protocols targeted to the Controls and Risks Committee, the Internal Auditing management and the Statutory Auditors.
The Board of Directors approves the risk policies and measurement parameters, guides and assesses the adequacy of the internal control and risk management system. The Controls and Risks Committee supports the Board of Directors in defining internal control and risk management guidelines.
The Executive Chairman and the CEO supervise, each within their area of responsibility, the internal control and risk management functions. The Vice Chairman oversees coordination between the Risks Committee and the Controls and Risks Committee, maintaining an independent status.
The risk governance structure is outlined here below:

Management methodology
Hera has introduced the Enterprise Risk Management (ERM) process, to provide the Board of Directors with useful elements for assessing the nature of corporate risks and defining the Group’s risk profile, particularly in the medium to long term. The definition of the risk profile is made explicit by the Board of Directors itself through the approval of the Group risk management policy and the risk limits established therein.
The risk management framework is formulated through three key elements:
On 21 February 2024, the ninth Enterprise Risk Management report on the 2024-2027 Business Plan was presented to the Board of Directors. Over the course of 2023, the ERM analysis made further improvements, while at the same time not revealing any critical risks, either in terms of reputation or operating-financial impact.
In the area of significant risks, compared to the previous year, the possibility of a worsened net financial position due to the scenario involving a downgrading of the Group’s rating to non-investment grade was added. Two scenarios present during the previous year were eliminated, concerning a deterioration of the net financial position due to extreme commodity price volatility and possible market criticalities for the sale of receivables arising from energy efficiency initiatives, thanks to the appropriate actions implemented by the Group.
In the same area, the risk of a reputational impact deriving from possible proceedings undertaken by supervisory/regulatory/investigation bodies was confirmed, generated by the degrees of discretion on the start of verification/investigation procedures, in the presence of non-univocal interpretative guidelines (despite the Group’s conduct always complying with the law), as was an operating-financial risk, deriving from high-intensity seismic events relating to networks.
The risk arising from the possibility of fires at waste treatment and recovery plants, while confirmed, has a negligible impact in terms of consequences on the Group’s results and none whatsoever for the environment and business continuity. However, due to the growing social awareness on the issue, such events can lead to significant reputational consequences due to perceived risk.
As part of a process based on ongoing development and refinement of its control and risk management system, the Group’s larger companies have adopted or are in the process of implementing a tax control framework model, in order to detect, measure, manage and control tax risk, understood as the risk of incurring violations of tax regulations or contrasting with the principles and purposes of the law. In particular, the Group has adopted a tax strategy that outlines the principles for managing tax variables and strategic lines aimed at ensuring compliance with regulations, as well as processes and procedures to mitigate tax risk, providing for a decision-making escalation correlated to the magnitude of the risk. The Board of Directors annually reviews the report on the progress of tax risk management and is the corporate body in charge of making final decisions should cases arise that present the highest risk profile due to uncertainty in legislative interpretation.
Risk areas: identifying and managing risk factors
The existing and emerging risks which Hera faces belong to different types: risks deriving from the evolution of the macroeconomic and financial, business (regulatory and competitive), technological, environmental and human capital contexts, including a constantly increasing attention towards climate change and sustainable development. Paragraph 1.01, “Contexts and trends, strategic approach and Group management policies”, provides a detailed analysis of the factors constituting some of the fundamental prerequisites for identifying these risks.
In order to mitigate exposure to these risks, introduce optimisation measures (including technological and efficiency improvements) within current structures and develop strategic planning that offers coherent responses, Hera carries out the specific analysis, measurement, monitoring and management activities described below.


Operating and financial area
Identifying commodity price risk
The Group operates in an integrated manner in the supply and sale of electricity and gas at different stages of the value chain. Hera is therefore exposed to risks arising from the volatility of energy markets, which are only partially mitigated by an integrated assessment of these markets and associated management strategies. Energy market risks are centralised in the Central Market Department, which is responsible for the purchase and sale of electricity and gas.
Managing commodity price risk
In order to standardise the approach to risk taken by the various corporate structures involved and with the aim of optimising the use of the market for hedging operations, the Group has adopted specific policies aimed at setting guidelines and operating procedures for the energy risk control and management process. Hera structured these processes to achieve an effective management of procurement and hedging concerning the energy market, with a clear focus on the skills involved. The Group’s approach provides for a single interface for the management of risk deriving from the energy market: Hera Trading. A unified risk management approach, in compliance with the assigned policies, provides advantages in terms of achieving higher levels of coverage, cost optimization by resorting less to the market, and greater flexibility in structuring procurement and supplying customers.
Identifying risks associated with the debt market
The operating and financial area, in addition to being characterised by fluctuating energy and commodity prices, may show different scenarios as a result of changes in interest rates, exchange rates, the credit spread and as an effect of possible liquidity crises. These fluctuations may have an impact on Group results, future growth and strategic investments (e.g. due to high refinancing costs).
The Group might not be able to meet its payment obligations due to an inability to raise new funds, or it may only be able to do so on unfavourable economic terms, due to an inability to liquidate assets on the market, or due to a changed risk perception. Among the factors determining this perceived risk, the creditworthiness assigned to Hera by rating agencies plays a key role, as it influences the possibility of accessing sources of funding and the related economic conditions.
The Group’s debt structure is not subject to financial covenants on debt balances, with the exception of the corporate rating limit (i.e. the assignment of a rating lower than BBB) defined on a portion of debt equal to approximately 150 million euro. On the other hand, with respect to the remaining outstanding debt, mandatory early repayment is provided for only in the event of a significant change of control over the Group, in the event that a concession is revoked (concession event), or assets are sold (sale of assets event), resulting in downgrading the Group to non-investment grade or lower, or terminating the publication of the rating.
Managing risks associated with the debt market
Hera’s financial management is centralised in the Administration, Finance and Control Central Department, which aims to maintain an adequate balance between the maturities of assets and liabilities, matching investments to consistent sources of financing in terms of duration and repayment methods while taking into account the need to refinance the current debt structure. In order to meet its medium- and long-term commitments, Hera’s strategy involves diversified financing sources and a balanced maturity profile, constantly monitoring rating indicators and the availability of long-term credit lines. This strategy is considered effective in minimising liquidity risk even in the event of particularly critical scenarios. Approximately 45% of the Group’s financial debt is long-term (more than five years) and 83% of this is represented by bonds with repayment at maturity. See note 26 to the consolidated financial statements, “Non-current and current financial liabilities”, for further details in terms of worst-case scenarios.
Moreover, the Group’s activities and strategies are particularly focused on ensuring that the highest rating level is maintained, as appears in its BBB+ rating with a stable outlook confirmed by S&P, or the Baa2 rating with a stable outlook confirmed by Moody’s.
Financial risk control and management processes are based on a careful monitoring of the Group’s financial indicators, as well as a permanent presence on the benchmark markets, to minimise the impact of interest rate and spread volatility so as to ensure efficient debt servicing. The Group also uses derivative financial instruments, where necessary, to reduce its exposure to interest and exchange rate fluctuations.
At 31 December 2022, the Group’s exposure to the risk of interest rate fluctuations was 3.9%, while the remaining 96.1% of debt is at a fixed rate. A 1% increase in the benchmark interest rate with respect to the business plan scenario would increase financial expenses by an average of approximately 6.5 million euro per year.
Identifying risks from counterparties
Hera operates with counterparties that might fail to fulfil their obligations, unable to comply with either economic terms or any contract provisions (delivery of goods or services). Additionally, credit risk affects the Group across the board, above all in the areas where commercial activities are carried out: the sale of energy commodities and services, waste treatment activities and telecommunication services.
Managing risks from counterparties
Hera has provided itself with a structured origination process, formalised in specific credit risk management procedures; this process allows the Group to adequately select its counterparties through credit checks and requests for guarantees, where applicable. In addition, its positions in relation to the counterparties are regularly monitored while articulated, proactive actions are planned, including external risk relocation through credit transfer, where appropriate. Expected losses are constantly estimated and monitored; the Group employs measures of default probability, exposure at default and loss-given default developed on the basis of its own historical series, customer payment behaviour and current credit processes. In order to test the soundness of the models, both internal and external information is used that may serve as a benchmark for the evolution of the macroeconomic environment.
In 2023, the 24-month unpaid ratio related to invoices issued in 2022 of the Group’s main sales companies amounted to 0.76%.
Regulatory and business area
Identifying competition and economic risks
Within the final reference market, which is mainly limited to Italy, the economic and geopolitical context, volatility in the prices of energy and other raw materials, as well as the difficulties connected to global logistics chains, all contribute to putting pressure on sales margins which, added to the increased competition on the free market, may impact the Group’s profitability.
The difficulty in forecasting volumes to cover the needs of the sales portfolio, continuously changing, may furthermore require Hera to purchase or sell additional energy on potentially unfavourable terms.
A potential reduction in waste production, related to the economic context and European and national regulatory frameworks and from new trends in customer behaviour, together with the unavailability of treatment and recovery infrastructures, may have a negative impact on the Group’s ability to pursue its objectives. The risks of the waste management business related to the management of its set of plants are concentrated in the Herambiente Spa.
Managing competition and economic risks
The Group has maintained elevated flexibility in energy commodity procurement sources while at the same time developing hedging activities to minimize exposure to operating risks from electricity generation, thus ensuring alignment with the market and maximising natural hedging.
In waste management and treatment activities, the Group’s diversified plant equipment features technologies that are cutting-edge and high-performance in terms of environmental impact, which to date have enabled the Group to achieve its strategic objectives. The implementation of a circularity strategy – for example, through the polymeric material recycling process carried out by Aliplast Spa – and the development of recycling lines for other types of plastics make it possible to seize the opportunities offered by the evolution of European regulations.
Free-market businesses have gained increasing importance in the Group’s portfolio, contributing significantly to its operating performance but also exposing it to growing competition. The Group responds to the challenge of competition by continuously innovating its sales offers and introducing new products in a timely manner, increasing its presence and customer base on the free market, and aiming to ensure the fulfilment of expectations in terms of service range and quality.
Risk analyses deriving from changes in the economic context (GDP and inflation) and energy market conditions (gas and electricity prices) make it possible to quantify the sensitivity of the Group’s Ebitda to changes in primary operating and financial indicators.
In particular, a 1% reduction in GDP compared with the business plan’s scenario would lead to an average annual drop in Ebitda coming to approximately 3.5 million euro.
A 1% reduction in the inflation rate compared with the business plan’s scenario would lead to an average annual drop in Ebitda coming to approximately 13 million euro (regulated market). A 1€/MWh increase in the price of gas and an ensuing rise coming to 2€/MWh in the price of electricity on the wholesale market compared to the indications set out in the business plan would lead to an average annual drop in Ebitda coming to roughly 0.9 million euro.
Identifying regulatory risks
Hera carries out part of its activities in a regulated market, and its operations are therefore influenced by the regulatory measures taken by the sector authorities and the government (in particular concerning tariffs and market structure), the concessions granted by local authorities (for regulated activities relating to waste collection services, gas distribution, integrated water service and public lighting) and national authorities (for electricity distribution), as well as by the impacts expected from changes in the market structure and its liberalisation, and from the evolution of supply and demand in the energy and waste management sectors.
Periodic updates of the legislative and regulatory framework, both at national and European levels, may therefore significantly impact the sectors in which Hera operates, influencing its profitability as a consequence.
Regulatory risks impact network businesses (water cycle, gas and electricity distribution and district heating) and the municipal waste collection business and result in the introduction or modification of economic, organizational and IT requirements to be met by Hera, and on potential market structure changes caused by them.
Tenders for gas distribution, the integrated water service, waste collection and street sweeping scheduled for the time covered by the Plan determine the risk of losing some of the areas currently managed, especially in contexts with a significant presence of competition, only partially offset by compensation for the portion of invested capital not yet amortized.
Managing regulatory risks
The Group’s organisational structure liaises with national and local authorities and carries out extensive consultation with institutional stakeholders, actively taking part in working groups established by authorities and adopting a transparent, co-operative, proactive approach towards possible regulatory instability.
The Group operates by making the most of its technical skills and management efficiency. Indeed, Hera’s focus on service quality, cost efficiency and innovation is a competitive strength in tenders for gas distribution, the integrated water service and waste collection and street sweeping services.
Identifying strategic risks
Strategic risks, associated with long-term planning, financial sustainability, involvement in strategic initiatives and appropriate investment decisions, affect the soundness of results for the various supply chains and business units. Moreover, the Group’s ability to achieve its strategic objectives may be compromised if the necessary licences, authorisations and permits to carry out its activities are not maintained or obtained.
Achieving the planned results is therefore conditioned by the different endogenous and exogenous risks that are simulated, measured and controlled as appropriate.
Managing strategic risks
Hera has developed a well-planned strategic risk analysis model designed to gauge the soundness of its Business plan against a variety of adverse risk scenarios, which supports an integrated risk projection from an enterprise-wide viewpoint. Thanks to this model, it is possible to perform scenario analyses, stress testing and what-if analyses of plan forecasts through an effective analysis of risk factors and related variables, and enables an adequate assessment of the risk level of the various business sectors.
Hera constantly monitors the authorisation processes and proactively participates in the working tables for obtaining permits, licences and authorisations, to avoid the possibility of jeopardising the regular performance of its activities.
Environmental-catastrophe, climatic, technological and human capital areas
Seismic, atmospheric and other climatic events may impact the Group’s performance. Hera intends to continue valorising its resources and to ensure that they are preserved and developed, so as to continue to enjoy their benefits in the future. The physical and transitional risks linked to climate change, as well as accidents in plant equipment, may generate potential environmental damage, and therefore the operating and strategic implementation of best practices in risk management and the opportunities deriving from climate change, are a fundamental objective for the Group. Risks arising from cybercrime, which Hera also assesses in terms of their impact on service continuity, are also being given increasing attention. Since accidents may pose a risk to people’s rights and freedoms, i.e. if they cause physical, material or immaterial damage, the Group’s policies regarding the parameters and acceptability thresholds are published on its web portal.
The risk management approach is organised according to the specific areas in which environmental, technological and human capital risks occur.
Identifying environmental-catastrophe risks
Hera, while aware of the need to preserve natural resources, uses them to provide essential services to its customers. The Group’s activities, in turn, make use of environmental, water and carbon resources, and adopting mitigation and adjustment measures to reduce environmental-catastrophe risks is therefore fundamental. In keeping with the ambitious goal to reduce current levels of greenhouse gas emissions compared to their current level, as set out by international organisations, the physical and transitional climate change risk scenarios relevant to the Group’s activities have been identified. For further details, please refer to the next section, “Identifying climate change risks”.
As regards the environmental standards with which Hera must comply in carrying out its businesses, the Group’s activities are subject to various rules and regulations, including rules relating to CO 2 emissions, emissions of other substances produced by combustion, water discharge and the handling of hazardous and solid waste. Non-compliance with CO 2 limits contributes to climate change, while non-compliance with legal limits on other environmental aspects leads to worsened environmental conditions and exposes the Group to fines.
Scarcity of water resources, or possible contamination of water reserves, may affect the regular water supply and cause service interruptions or significant environmental, economic and social damage, worsening the water stress by which these natural resources are affected by their very nature, in order to meet water demand.
In addition, note the risks stemming from the impact on the Group of weather variability in relation to the electricity and gas demand deriving from the various scenarios.
Managing environmental-catastrophe risks
Investments aimed at preventing and reducing the frequency of harmful events and measures to curb their severity, play a key role.
The Group’s commitment to reducing carbon dioxide production began with reporting on its own performance and commitments in the area of climate change, and continues with projects to promote energy production from renewable sources, reduce energy consumption, and provide customers with opportunities to cut greenhouse gas emissions. The Group is committed to contributing to mitigating environmental risks by complying with the energy efficiency objectives set by national legislation and the United Nations, continuing to improve its production facilities and encouraging virtuous and responsible forms of consumption on the part of its customers. The Group only uses electricity from renewable sources to operate its production sites. In relation to the consequences of extreme events, which are expected to occur with increasing frequency as a possible consequence of climate change, Hera has taken steps to adopt important measures. For example, the Rimini seawater safety plan, currently underway, in addition to maintaining the quality of marine resources, increases the resilience of the stormwater drainage infrastructure in the event of extreme events. For further details on specific initiatives, please refer to the section “Mitigating climate change” in the Hera Group’s Sustainability Report.
Hera has adopted an environmental control system that is effective both in terms of the governance of environmental certification processes and related audits, and in terms of the operational management of controls and surveys. The Group succeeds in tackling environmental hazards by constantly monitoring potential pollution factors and ensuring transparency in surveys, as well as through substantial investments in technological plants that ensure consistently better air and water quality than required by legal limits. For more details, see the sections on “Protection of air, soil and biodiversity” and “Sustainable water management” in the Sustainability Report. Moreover, in line with its circular economy strategy, Hera has already invested (and continues to do so in the medium-to-long term) in sorting, recovery and composting plants, increasing the amount of waste treated while at the same time reducing the use of landfills, thus anticipating the requirements of European and national regulations. For further details, see the “Transition to a circular economy” section in the Sustainability Report.
Strengthening the resilience of the Group’s water supply and distribution system in a medium to long-term outlook continues. Furthermore, the reduction of the water footprint is pursued through the water management system, which aims to promote a sustainable management of this resource both inside the Group (by preventing network leaks, reducing diffuse consumption, recovering rainwater for irrigating green areas and washing vehicles) and externally (by monitoring domestic consumption and offering advice and solutions to optimise it, providing support with technological solutions for water-demanding customers, and providing support for the construction of treatment plants to reuse/recover water). The implementation of water safety plans in the integrated water service also ensures an approach to water quality management based on risk assessment and management, and thus on prevention and control.
Regarding weather-variable risks, the Group relies on advanced energy demand-forecasting tools that ensure an optimal use of the available sources. It also relies on adequate flexibility in the supply sources of energy commodities, ensuring their availability at market rates. A 1°C increase in the average winter temperature, compared with the scenario set out in the Business plan, would lead to an average annual drop in Ebitda of approximately 16 million euro.
Identifying climate change risks
The physical and transitional risks from climate change scenarios pertinent to the Group’s activities have been classified according to their potential consequences on business, and submitted to further impact and mitigation assessments in relation to their criticality (some examples include extreme weather phenomena such as floods and droughts as well as health and economic risks).
Climate scenario analysis is a methodology to test the resilience of business plans under different assumed future developments. Hera selected the two most relevant scenarios, of which the IEA ETP 2DS transition scenario by the International Energy Agency, chosen as an ambitious climate scenario, envisages a future evolution characterised by strong decarbonisation processes in order to keep the temperature increase below 2°C: this scenario has been used in identifying transition risks. The IPCC RCP 8.5 physical scenario, chosen as a pessimistic scenario, instead envisages a “business-as-usual” trend and consequent sharp temperature rise (approximately 4°C): this scenario has been used in identifying physical risks.
Based on these scenarios, eight physical risks and eight transition risks were identified, associated with related business impacts:
| Type | Causes |
|---|---|
| Physical risks |
|
| Transition risks |
|
*These are the most significant risks currently being addressed, as described in section 2.04, “Climate Change Mitigation”, of the Sustainability Report.
Each risk and opportunity has been associated with a timeline, a priority level (defined as the combination of the probability that the context in which Hera operates will change and the impact of the risk/opportunity on the business) and consequent management methods and business initiatives, in the case of the opportunities identified. In particular, physical risks are distributed over two medium- and long-term periods, consistent with the principle that climate change impacts will become more evident in the medium-long term. Transition risks, on the other hand, are mainly concentrated in the medium term.
In order to assess potential impacts on the Group’s assets deriving from extreme phenomena related to climate change, a flood risk analysis was completed in 2022, with a medium/long-term time projection. The results show that the average annual loss referred to timelines reaching 2030 and 2050, in accordance with the PCP 8.5 scenario, increases by 0.2 million euro and 0.5 million euro, respectively, compared to current conditions.
Risk assessment activities are also continuing with the appropriate level of detail, especially with regard to transition risks and their modelling. Based on the current analyses, there are no risks that could lead to the need for impairment losses on the Group’s assets.
For assessments of the potential effects in terms of impairment tests, specifically in relation to gas consumption, see note 25 of the consolidated financial statements in Chapter 2.02, “Explanatory notes”.
Managing climate change risks
Hera has launched a series of initiatives to mitigate the effects of climate change, and at the same time reduce its own carbon footprint. One or more management modalities have been associated with each risk: 21 management modalities have been identified for physical risks and 13 for transitional risks; some of the ensuing actions have already been integrated into the investments made, and included in the business plan. For further details, see the section “Hera for the climate” in the Sustainability Report. The investments and the mitigation and adaptation actions planned to date, defined on the basis of the energy transition towards carbon neutrality and the environmental transition towards a circular economy, as well as technological evolution, are in line with European strategies and the goals set out in the UN 2030 Agenda, have become part of the Group’s modus operandi and are often carried out ahead of the estimated timeframe thanks to the Group’s positive results.
| Type | The Group’s main initiatives/actions |
|---|---|
| Mitigation activities |
|
| Adaptation activities |
|
Identifying operational and ICT security risks
Despite careful planning and insurance protection, negative externalities generated by exceptional events may jeopardise business continuity and increase the financial requirements for restoring normal operations. The provision of public utilities therefore requires both preventive activities and actions to counter interruptions, delays or poor service levels. Technological risks include the operational security of distribution networks (fluids and electricity), the logical security of information, the security of communication networks and information systems, and the reliability of remote-control systems. The main threats to on-premise systems (hosted in company data centres) or in the cloud include identity theft, phishing aimed at taking control of a personal computer and then attacking central systems, and attacks on exposed services such as public websites.
The security of the information used, produced and processed by the company depends on the way it is managed and the human and technological resources involved. The loss of confidentiality, integrity and availability of corporate information, whether business-critical information or personal information (i.e. any data relating to natural persons, as more fully defined by the European regulation GDPR and the privacy code of Legislative Decree 196/03) may result in serious financial losses with consequent damage to market image. A business impact analysis has been carried out on all ICT systems used by the Group, and a security risk analysis is carried out annually to identify and assess risk, using a methodology based on a framework that considers three areas of security: availability, integrity and confidentiality. Monitoring ICT performance and risks, using specific Cyber Security indicators, is a key aspect of security.
Managing operational and ICT security risks
The main service for managing operational risks is centralised network monitoring (remote control of fluids and the electricity grid), which ensures continuous real-time monitoring and supervision and, in some areas, remote management. In operational terms, centralised monitoring makes possible to promptly report potential critical factors to the technical structures in charge of emergency response and, where possible, to intervene directly to resolve the potential critical situation. These systems have been used in a variety of situations, allowing the service to be restored within an appropriate timeframe and ensuring adequate resilience of the services offered.
As regards IT security, the Group’s Security Operation Centre is active, i.e. the centralised service for real-time monitoring of events affecting information systems, IT infrastructures and industrial areas (OT). In addition to this, as every year, testing activities continued in order to continuously assess the level of penetrability of exposed systems and network security, as well as carrying out training campaigns to raise the awareness of all Group employees.
During 2023, interventions continued to be implemented aimed at ensuring the confidentiality, integrity and availability of Hera’s systems. One example, in the context of industrial plants, concerns the ongoing development of the cyber security monitoring model converging between the IT (information technology) and OT (operation technology) areas. In order to detect any vulnerabilities on systems or applications that could be exploited by an attacker, vulnerability assessment activities also continued in the industrial plant area.
Identifying people’s safety and development risks
People and their behaviour increasingly influence the effectiveness of corporate strategies. Protecting people thus remains a key element that must be reflected in workplace health and safety and in terms of social protection. The Group therefore continually focuses on the emerging needs and requirements of all employees.
Hera’s structured process for identifying hazards and the related risk assessment in the area of health and safety concentrates on an analysis of roles, work activities, processes, workplaces, equipment, vehicles, plants and substances used. The risk mitigation measures adopted and the effectiveness of their implementation are periodically monitored and reviewed. In this regard, a specific checklist has been developed allowing the heads of the various organisational units to periodically monitor personnel behaviour.
With the aim of identifying, measuring and monitoring the risks that threaten the Group’s assets and the continuity with which it provides essential services, a risk assessment model has been implemented for the physical security of these assets. This model aims to prevent and mitigate threats and impacts caused by events (malicious, culpable or accidental) such as fire, theft and acts of sabotage/vandalism.
Managing people’s safety and development risks
In order to ensure worker health and safety and mitigate on-the-job injury risk, the Group is constantly committed to measures promoting better monitoring as well as to the enhancement of safety protection and prevention practices aimed at reducing the frequency and severity of accidents. The teaching methods chosen for worker training are no longer solely technical or normative, but geared towards developing self-awareness in the perception of risk and in adopting safe and aware behaviour.
The prevention and protection measures put in place by the Group aim to minimize the probability of an adverse event occurring, and lower the severity of the consequences following the event. It is of fundamental importance for Hera to develop workers’ awareness of the risks associated with their work, and the company increasingly uses training courses that encourage people to gain greater awareness, modifying their own behaviour in terms of risk perception and becoming a virtuous example for other workers. Focusing on these aspects is an essential element of operations, in order to maintain a steady decrease in the number of injuries, the accident frequency rate, the severity rate and the number of days of absence due to injury. In this respect, the Group has obtained important certifications for occupational health and safety, such as ISO 9001 (quality management system), ISO 14001 (environmental management system) and ISO 45001 (health and safety on the workplace). The process of hazard identification and risk assessment and control is carried out in a preventive and proactive (rather than reactive) manner, in order to identify appropriate risk reduction and control measures.
The ongoing commitment shown by people and the integration of safety into processes and training are the cornerstones of the Group’s safety culture. This strategic element of risk management is based on the premise that everyone is responsible for their own health and safety, as well as that of the people with whom they interact. This principle has been included in the procedure for managing the process of identifying hazards and assessing risks to the health and safety of workers. This procedure ensures that each employee promptly reports and halt any risky situation or unsafe behaviour. In addition, in 2023, the heads of the organisational units completed and managed approximately 5,000 control checklists, aimed at monitoring the measures adopted and potentially reporting the need for any improvements (for example, enhancing training for personnel).
In order to maintain a high level of efficiency in carrying out its activities and guarantee the highest level of safety in the workplace and compliance with environmental standards, and reduce risks related to the continuity of services, Hera has drawn up a multi-year technical-management project for physical safety that:
For example, to better manage events, the Group’s synergies, skills and resources have been made use of by centralising the alarm reception point in a control room with a view of all alarms/alerts concerning assets, and also by managing the global contractor’s networks and systems (for installation and maintenance of systems, and activation of surveillance services). Lastly, with reference to social wellbeing and to foster a positive working environment, Hera has created a welfare system based on attention to people. This system includes interventions which are monetary or linked to the quality of life, such as services relating to the family, education, work-life balance, wellbeing, leisure and health.
For the Hera Group, 2023 closed with improvement in operating results and investments compared to the previous year. Adjusted Ebitda came to 1,494.7 million euro, up 15.4%; adjusted Ebit increased by 18.0%, and adjusted net profits rose by 12.0%. As regards investments as well, significant growth was seen, coming to 13.1% compared to 2022, reflecting the Group’s ongoing focus on the growth, valorisation and reinforced resilience of the assets under management. Lastly, the financial structure showed significant improvement compared to 2022, with Net debt/Ebitda reaching 2.56x.
These 2023 results must be considered against an external scenario that showed less volatility in energy commodity prices, allowing the Hera Group to operate once again in a more stable market context, even if not yet similar to the one prior to the crisis. In addition, the Group has shown strong resilience when faced with the extreme weather and climate phenomena that occurred in the areas it serves.
The Group’s performance is still driven by its multi-business strategy, balanced between regulated and free market activities, with a focus on sustainability and the circular economy. The Hera Group pursues this model through both internal growth and the opportunities offered by the market thanks to external development, with the aim of providing customers with innovative, competitive and increasingly complete solutions.
In particular, note that in 2023 the Hera Group continued to expand the scope of the business areas in which it operates. In the waste management area, a second biomethane production plant located in Spilamberto (MO), became fully operational, and 60% of A.C.R. di Reggiani Albertino Spa was acquired. The latter is an important company operating nationwide in the remediation, industrial waste treatment, industrial plant decommissioning and oil & gas-related civil works sectors. More detailed information on this topic is provided in paragraph 1.07.04.
In the IT-TLC area, the Group’s acquisition with Ascopiave of 92% of Asco TLC Spa – later followed by the merger by incorporation of this company into subsidiary Acantho – strengthened Hera’s connectivity, telephony and data centre services in more than one region.
Finally, in the energy area, the Ferrara-based company Tiepolo Srl was acquired, for the construction of a photovoltaic solar park in Bondeno, and 60% of Rimini-based F.lli Franchini Srl, involved in installing plumbing and electrical systems and photovoltaic solutions for business customers.
Lastly, note the establishment of Horowatt Srl, the Hera Group and Orogel’s NewCo for the construction within 2024 of a sustainable, state-of-the-art agrivoltaic plant inside the Cesena facilities of this agricultural cooperative.
Also note that Hera Comm Spa was awarded two of the nine lots of the safeguarded service for 2023 and 2024, one lot more (two overall) than in the previous two-year period, and was awarded one of the 12 lots of the gradual protected service for supplying electricity to micro-businesses for the period from 1 April 2023 to 31 March 2027. More detailed information on this topic is provided in paragraph 1.07.02.
The following table shows operating results at 31 December 2023 and 2022:
| Income statement (mn€) | Dec 23 | % Inc. | Dec 22 | Inc. change | Abs. change | % change |
|---|---|---|---|---|---|---|
| Revenues | 14,897.3 | 0.0% | 20,082.0 | 0.0% | (5,184.7) | (25.8)% |
| Other operating revenues | 667.8 | 4.5% | 548.2 | 2.7% | 119.6 | 21.8% |
| Raw and other materials | (9,765.2) | (65.6)% | (16,635.9) | (82.8)% | (6,870.7) | (41.3)% |
| Service costs | (3,655.9) | (24.5)% | (2,105.8) | (10.5)% | 1,550.1 | 73.6% |
| Other operating expenses | (90.3) | (0.6)% | (74.9) | (0.4)% | 15.4 | 20.6% |
| Personnel costs | (641.1) | (4.3)% | (601.1) | (3.0)% | 40.0 | 6.7% |
| Capitalised costs | 82.1 | 0.6% | 82.5 | 0.4% | (0.4) | (0.5)% |
| Ebitda* | 1,494.7 | 10.0% | 1,295.0 | 6.4% | 199.7 | 15.4% |
| Amortization, depreciation and provisions | (753.7) | (5.1)% | (667.1) | (3.3)% | 86.6 | 13.0% |
| Ebit* | 741.0 | 5.0% | 627.9 | 3.1% | 113.1 | 18,0% |
| Financial operations | (177.6) | (1.2)% | (125.0) | (0.6)% | 52.6 | 42.1% |
| Pre-tax result* | 563.4 | 3.8% | 502.9 | 2.5% | 60.5 | 12.0% |
| Taxes | (146.4) | (1.0)% | (130.6) | (0.7)% | 15.8 | 12.1% |
| Net result* | 417.0 | 2.8% | 372.3 | 1.9% | 44.7 | 12.0% |
| Result from special items | ‐ | 0.0% | ‐ | 0.0% | ‐ | 100.0% |
| Net profit for the period* | 417.0 | 2.8% | 372.3 | 1.9% | 44.7 | 12.0% |
| Attributable to: | ||||||
| Parent company shareholders* | 375.2 | 2.5% | 322.2 | 1.6% | 53.0 | 16.5% |
| Non-controlling interests | 41.8 | 0.3% | 50.1 | 0.2% | (8.3) | (16.6)% |
* Adjusted results, as described in paragraph 1.02
REVENUES
(bn/euro)

Revenues in December 2023 dropped by 5,184.7 million euro compared to 2022. The energy segments showed a 5,570 million euro decrease, mainly due to the drop in energy commodity prices and lower gas volumes due to lower trading activities and the mild weather seen during the year, despite the eight lots awarded out of nine in last resort gas supplier service (for customers with public service activities or without a supplier) for the period from 1 October 2023 to 30 September 2025 (compared to six lots awarded in the previous tender), the confirmation of all nine lots of the default gas distribution service (for customers in arrears) for the period 1 October 2023 - 30 September 2025 and the three lots awarded out of twelve in the Consip GAS15bis tender for supplying natural gas to Public Administrations in 2023-24 (compared to two lots in the previous tender).
This decrease was partially offset by higher volumes of electricity sold, thanks to the commercial development actions, the awarding of four of the seventeen lots of the Consip EE20 tender for supplying electricity to public administrations in 2023 (confirming the results of the previous tender) and the two safeguarded lots.
In addition, growth was seen in turnover for energy services, related to energy efficiency in residential buildings (insulation bonus and 110% super-bonus) and an increase in activities for value-added services for customers. As a whole, these effects contributed with roughly 421 million euro.
Lastly, revenues in the waste management sector contributed to this growth with 85.9 million euro, and increase due in particular to the acquisition carried out in the industry market.
For further details, see the analyses of the individual business areas in paragraph 1.07.
Other operating revenues in December 2023 increased by 119.6 million euro compared to 2022, mainly due to higher revenues from contracts on assets under concession and energy efficiency certificates.
Costs for raw and other materials decreased by 6,870.7 million euro compared to December 2022. This decrease is mainly due to the performance of energy revenues, linked to the decrease in energy raw material prices, due to the more stable markets seen over the past year and the lower volumes of gas traded and sold, as mentioned above.
Other operating expenses increased by 1,565.5 million euro (higher service costs amounting to 1,550.1 million euro and higher operating expenses coming to 15.4 million euro). Roughly 950 million euro overall in higher costs for gas transport and storage and system charges were recorded. The latter, which during the previous year had been set at zero to deal with the energy crisis, were fully reinstated, as indicated in paragraphs 1.07.01 and 1.07.02. Energy services for energy efficiency and value added services saw higher costs for works coming to 395 million euro. These were accompanied by higher costs for waste collection and treatment coming to approximately 140 million euro, mainly due to the previously mentioned corporate acquisitions, higher transport costs and increased activities in developing new sorted waste collection projects. In addition, higher costs were related to orders on goods under concession coming to roughly 19 million euro, and to an increase in prices for all main services.
Personnel costs increased by 6.7% compared to December 2022, amounting to 40.0 million euro. Approximately 30.0 million euro of this increase was due to the change in the scope of consolidation generated by the corporate acquisitions described above. Net of this event, the increase in personnel costs was limited to 1.7%, caused by the salary increases required by the national collective labour agreement.
Capitalised costs were essentially in line with the previous year.
EBITDA*
(mn/euro)

Adjusted Ebitda rose by 199.7 million euro compared to 2022, up by 15.4%. This trend is due to the 169.4 million euro overall contribution coming from the energy areas, the good performances of the waste management area, up 15.4 million euro, and lastly the 9.5 million euro contribution from the water cycle and the 5.4 million euro contribution from other services.
For further details, see the analyses of the individual business areas.
Amortisation, depreciation and provisions at 31 December 2023 increased by 86.6 million euro year-on-year, up 13.0%, mainly due to new operating investments, an increase in activities for the acquisition of new customers, and changes in the scope of consolidation arising from the consolidation of companies involved in remediation and waste treatment activities or specialised in the construction of technological plants and renewable energy. Allocations to the provision for bad debts increased, reflecting the increase in the Group’s customer base in the various service areas.
EBIT*
(mn/euro)

Adjusted Ebit amounted to 741.0 million euro, up 18.0% compared to 2022, showing a higher level of growth than Ebitda*, since amortisation, depreciation and provisions, as described above, increased to a lesser degree than the rise in Ebitda*.
The result of financial operations increased by 52.6 million euro compared to 2022. This change is due to the increase in average annual indebtedness that became necessary, particularly in the first six months of the year, to deal with the increased investment in working capital created by the significant increase in energy commodity prices and their volatility seen in the previous year. This was accompanied by a gradual increase in the cost of money in financial markets, brought about by the ECB’s restrictive monetary policies. The liability management activities carried out by the Group during 2023 allowed it to progressively contain the changes seen in financial charges, optimising the financial structure, while strengthening its flexibility and capacity to respond effectively to any future abnormal volatility.
The adjusted pre-tax result showed a 12% increase compared to December 2022. The growth deriving from Ebit was only partially offset by the trend in financial operations mentioned above.
The taxes for 2023 shown in the managerial statement amounted to 146.4 million euro, up from 130.6 million euro in 2022. The 26% tax rate was essentially in line with the previous year. In this comparison, note that in both years the benefits arising from the redemption of the higher value arising from certain acquisitions were recognised, as well as the tax credits recognised for the purchase of electricity and gas, pursuant to Decree-Law 4/2022 and subsequent measures which are not relevant for tax purposes. Furthermore, the taxes accrued in 2022 included the “non-recurring contribution against high utility bills” provided for by Law No. 51/2022, which converted Article 37 of Decree-Law No. 21/2022, amounting to 2.3 million euro.
As a result of all the events described above, adjusted net profit increased by 44.7 million euro compared to the figure seen in December 2022.
At the end of 2023, the Group’s cumulative net investments amounted to 779.2 million euro, up 90.5 million euro year-on-year.
Capital grants amounted to 36.5 million euro, of which 19.5 million euro related to FoNI investments, as foreseen by the tariff method for the integrated water service, and increased by a total of 12.6 million euro year-on-year.
The following table provides a breakdown by business area, with separate mention of capital grants:
| Total investments (mn€) | Dec 23 | Dec 22 | Abs. change | % change |
|---|---|---|---|---|
| Gas area | 191.8 | 156.7 | 35.1 | +22.4% |
| Electricity area | 124.5 | 78.3 | 46.2 | +59.0% |
| Integrated water cycle area | 228.2 | 208.0 | 20.2 | +9.7% |
| Waste management area | 150.8 | 149.2 | 1.6 | +1.1% |
| Other services area | 13.8 | 15.3 | (1.5) | (9.8)% |
| Headquarters | 106.7 | 102.1 | 4.6 | +4.5% |
| Total gross operating investments | 815.8 | 709.5 | 106.3 | +15.0% |
| Capital grants | 36.5 | 23.9 | 12.6 | +52.7% |
| of which FoNi (New Investments Fund) | 19.5 | 17.4 | 2.1 | +12.1% |
| Total net operating investments | 779.2 | 685.5 | 93.7 | +13.7% |
| Financial investments | ‐ | 3.2 | (3.2) | (100.0)% |
| Total net investments | 779.2 | 688.7 | 90.5 | +13.1% |
TOTAL NET OPERATING INVESTMENTS
(mn/euro)

Including capital grants, the Group’s operating investments amounted to 815.8 million euro, up 106.3 million euro on the previous year, and mainly related to works on plants, networks and infrastructures. In addition, regulatory upgrading was done, especially in the gas distribution sector for the large-scale metre replacement, and in the purification and sewage sector.
Comments on investments in the individual areas are provided in the analysis by business area.
At Group headquarters, investments concerned interventions on corporate buildings, IT systems and the vehicle fleet, as well as laboratories and remote control structures.
Overall, structural investments amounted to 106.7 million euro, up by 4.6 million euro compared to the previous year, mainly due to renewals on company fleets and investments in Group IT systems.
What follows is an analysis of trends in the Group’s net invested capital and sources of financing at 31 December 2023.
|
Invested capital and sources of financing (mn€) |
Dec 23 | % inc. | Dec 22 | % inc. | Abs. change | % change |
|---|---|---|---|---|---|---|
| Net non-current assets* | 8,119.2 | +107.1% | 7,522.3 | +94.5% | 596.9 | +7.9% |
| Net working capital* | 166.0 | +2.2% | 1,096.0 | +13.8% | (930.0) | (84.9)% |
| (Provisions) | (705.9) | (9.3)% | (657.6) | (8.3)% | (48.3) | (7.3)% |
| Net invested capital* | 7,579.3 | +100.0% | 7,960.7 | +100.0% | (381.4) | (4.8)% |
| Equity* | (3,751.6) | +49.5% | (3,710.9) | +46.6% | (40.7) | (1.1)% |
| Long-term borrowings | (4,315.4) | +56.9% | (5,598.5) | +70.3% | 1,283.1 | +22.9% |
| Net current financial debt | 487.7 | (6.4)% | 1,348.7 | (16.9)% | (861.0) | (63.8)% |
| Net financial debt | (3,827.7) | +50.5% | (4,249.8) | +53.4% | 422.1 | +9.9% |
| Total sources of financing* | (7,579.3) | (100.0)% | (7,960.7) | +100.0% | 381.4 | +4.8% |
* adjusted results, as indicated in the section on Alternative performance measures (APMs)
Net working capital* amounted to 166 million euro at the end of 2023, down compared to 1,096 million euro at the end of 2022. This change was affected by the fair value of commodity derivatives, which increased by 233.4 million euro compared to the previous year, with a corresponding impact on equity for hedging contracts recognised as cash flow hedges and, to a lesser extent, on the income statement for the year for trading derivatives. The changes in net working capital that led to a corresponding impact in net financial debt were mainly due to:
As concerns the value of trade receivables, there were no critical issues on the performance of collections, which in some market segments were better than the previous year thanks to the continuous and careful control of credit management processes including during the acquisition of contracts (origination management).
In 2023, provisions amounted to 705.9 million euro, up from 657.6 million euro at the end of the previous year. This result is mainly the consequence of provisions for the period and adjustments to the post-mortem provisions for landfills and restoration of third-party assets, which more than offset releases for utilisation.
Equity* rose from 3,710.9 million euro in 2022 to 3,751.6 million euro in 2023, increasing the Group’s solidity thanks to the positive net result from operations in 2023, amounting to 417.0 million euro, and the change in minority interests, which more than offset the reduction in cash flow hedge reserves, dividend payments and changes in treasury shares.
Adjusted return on net invested capital (ROI*) settled at 9.8% in 2023, up compared to 2022 ROI, which came to 7.9%, due to the increased result from operations (Ebit) and a fall in net invested capital (NIC), caused by the positive impact of the changes in net working capital*.
ROI*
(%)

* adjusted for non-recurring entries and the Ascopiave transaction
The results of management led to a return on equity (ROE) coming to 11.1%, up from the amount seen in 2022. This increase was due to the rise in profits for the period, which was greater than the growth in equity.
ROE*
(%)

* adjusted for non-recurring entries and the Ascopiave transaction
An analysis of adjusted net financial debt is shown in the following table:
| mn€ | 31 Dec 23 | 31 Dec 22 | |
|---|---|---|---|
| A | Cash holdings | 1,332.8 | 1,942.4 |
| B | Cash equivalents | ‐ | ‐ |
| C | Other current financial assets | 90.9 | 77.7 |
| D | Liquidity (A+B+C) | 1,423.7 | 2,020.1 |
| E | Current financial debt | (411.9) | (563.0) |
| F | Current portion of non-current financial debt | (524.1) | (108.4) |
| G | Current financial indebtedness (E+F) | (936.0) | (671.4) |
| H | Net current financial indebtedness (G+D) | 487.7 | 1,348.7 |
| I | Non-current financial debt | (703.9) | (1,997.0) |
| J | Debt instruments | (3,391.2) | (3,197.3) |
| K | Non-current trade and other payables | ‐ | ‐ |
| L | Non-current financial indebtedness (I+J+K) | (4,095.1) | (5,194.3) |
| M | Total financial indebtedness (H+L) | (3,607.4) | (3,845.6) |
| Non-current financial receivables | 162.8 | 151.8 | |
| Net financial debt (excluding put option) | (3,444.6) | (3,693.8) | |
| Nominal amount - fair value put option | (337.2) | (475.9) | |
| Net financial debt with adjusted put option | (3,781.8) | (4,169.7) | |
| Portion of future dividends - fair value put option | (45.9) | (80.1) | |
| Net financial debt (Net debt) | (3,827.7) | (4,249.8) |
Total net financial debt amounted to 3,827.7 million euro, down by approximately 422.1 million euro compared to the previous year, thanks to the positive performance of net working capital.
With a view to rebalancing its net working capital, the Group continued, on a routine basis during the year, to reschedule trade payables, by means of letters of credit, totalling 404.6 million euro (506.3 million euro in the previous year). At the end of the financial year, the amount of outstanding transactions amounted to 187.9 million euro (192 million euro at the end of the previous year). By means of these transactions, the Group optimised its payment terms, while keeping the same amount recorded under trade payables, since this is part of its typical working capital management. Note, in fact, that the Group has trade payables, with different payment terms, based on the contractual agreements defined with the individual counterparties of the various businesses in which it operates, ranging from 7 days to 60 days from the date of invoice issuance.
The financial structure showed total current indebtedness coming to 936 million euro, up 264.6 million euro compared to the previous year.
Current financial debt amounted to 411.9 million euro, down by 151.1 million euro, mainly due to the lower impact of payables related to the daily fair value adjustment of commodity derivatives. The amount recorded at December 2023 includes payables to banks coming to 92.6 million euro, referring to utilisations of account lines coming to roughly 20.7 million euro and accruals for interest on loans amounting to 71.9 million euro. In addition, 154.1 million euro in financial payables were recorded, related to the gas settlement for the provisional adjustment session that occurred in 2023. For more details, see Note 19, “Financial liabilities”, in Section 2.02.04, “Equity and financial structure”, of the consolidated financial statements.
The current portion of non-current financial debt came to 524.1 million euro, up 415.7 million euro, and included 438 million euro in bonds maturing in 2024 (149.8 million euro Aflac Bond and 288.3 million euro residual Green Bond). This also included 24.5 million euro in current payables for leasing contracts.
Non-current financial debt decreased by 1,099.2 million euro compared to the previous year, due to the repayment of 750 million euro in loans and the classification in the non-current portion, with subsequent early repayment, of a 500 million euro bridge loan taken out in 2022. This figure includes a new 600 million euro sustainable bond issue (Sustainability-Linked Bond), which was finalised in April 2023, and also decreased due to the reclassification of 438 million euro of maturing bonds to short-term debt. Note that, in order to guarantee any extraordinary liquidity needs, a 450 million euro sustainable revolving line with a duration of five years was in any case stipulated with a primary pool of banks, as was a 460 million euro credit line with a duration of sixteen years and a three-year availability period, with the EIB. These new lines were not yet used at 31 December 2023.
A decrease occurred in cash holdings, which were down from 1,942.4 million euro in 2022 to 1,332.8 million euro at 31 December 2023, as a result of the cash flow from operations and the liability management transactions carried out on debt.
At 31 December 2023, 83% of medium- and long-term debt consisted of bonds with repayment at maturity. Total medium- and long-term debt, 96% of which is fixed-rate, had an average residual maturity coming to approximately five years and two months, with 46.3% of debt maturing after five years.
NET FINANCIAL DEBT (NET DEBT)
(bn€)

Core business operations generated positive operating cash flows amounting to 725.9 million euro, which fully financed dividend payments and contributed to financing all shareholding acquisitions, including the acquisition of 60% of A.C.R. Spa, operating in the waste management sector, 60% of the Rimini-based company F.lli Franchini Srl, operating in the technological plants and renewable energy sector, and 36.8% of Asco TLC Spa, a company providing ICT services, later merged into Acantho Spa.
CASH FLOW
(mn/euro)

The Net debt/Ebitda* ratio for 2023 fell to 2.56x, as against 3.28 in 2022, returning to the level seen prior to the crisis in energy markets.
NET DEBT/EBITDA*
(X)

* adjusted for non-recurring entries and the Ascopiave transaction
The FFO*/Net debt ratio settled at 25.6%, confirming the Group’s financial solidity and its ability to meet its financial obligations.
FFO*/NET DEBT
(%)

* adjusted for non-recurring entries and the Ascopiave transaction
The Group’s commitment to reporting to stakeholders as to the results achieved in the areas of creating shared value (CSV) and sustainability was confirmed once again this year by its Sustainability Report, available at bs.gruppohera.it and on the Group’s website in the sustainability section.
The Sustainability Report contains the Hera Group’s consolidated non-financial statement, prepared pursuant to legislative decree 254/16, and acts as a separate report compared to this Directors’ report, as provided for in Article 5, paragraph 3, letter b) of legislative decree 254/16. The Sustainability Report also includes indicators and information relating to the environment, personnel and research and development activities.
What follows is a summary of the main results reported in the Sustainability Report for 2023, a year that saw Hera stock included, for the fourth consecutive year, in the Dow Jones Sustainability Index World and Europe, with a score that positions the Group among the best companies in the Multi and Water Utilities sector. Once again concerning green finance, a new 600 million euro sustainability-linked bond with carbon neutrality and circular economy goals was issued in 2023. This new bond follows up on the previous one, issued in 2021, and the three green bonds issued from 2014 (the first Italian green bond) to 2022 (first Italian green bond aligned with the EU Taxonomy). Thanks to this strong focus on green finance, the portion of debt financed with ESG instruments has gradually increased over the years, reaching 57% in 2023.
The 2023 Sustainability Report consolidates its representation of content focused on creating shared value. The achievements made and the targets set for the future are accompanied by a summary of the scenario related to the three drivers for creating shared value: (i) Energy - pursuing carbon neutrality, (ii) the Environment - regenerating resources and closing the circle, (iii) Local areas (and Businesses) - enabling resilience and innovating, to which an equal number of chapters are dedicated, representing the most significant part of the report.
One of the strengths of the Group’s reporting is its quantification of shared value Ebitda (CSV Ebitda), i.e. the portion of Ebitda that derives from business activities capable of meeting the objectives on the Global Agenda, which refers to calls to action for sustainable growth summarised in the three drivers mentioned above.
In 2023, CSV Ebitda amounted to 776 million euro, corresponding to 52% of the Group’s total Ebitda and 16% higher than in 2022, placing it on the track set out by the business plan, which was constructed for 2027 CSV Ebitda to reach over 1 billion euro and cover 64% of total Ebitda. A contribution to creating shared value also stems from investments pertaining to the three CSV drivers, which in 2023 amounted to 558.4 million euro, approximately 69% of total gross operating investments.
The quantification of CSV Ebitda and investments for 2023 was reviewed for the fifth consecutive year by an auditing company, with the aim of validating these distinctive aspects of the Group’s reporting to all stakeholders.
Hera pursues carbon neutrality in its activities and those of its customers and the communities it serves by promoting energy efficiency and energy transition projects.
As regards energy efficiency, note that:
With regard to the energy transition and renewable energies, Hera continued to promote its carbon-neutral commercial offer in 2023 as well, achieving at the end of the year:
Internally, in 2023 the Group confirmed once again the green profile of its electricity consumption, which as of 2022 is covered by 100% renewable energy.
Concerning the projects implemented in 2023 for the development of renewables, note:
Lastly, based on the fourth report drafted according to the Science Based Targets initiative methodology, the Group’s greenhouse gas emissions (Scope 1+2+3 from electricity and downstream natural gas sales) showed a 13.8% reduction in 2023, compared to the 2019 base year (excluding the transitional increase in volumes sold in last resort gas services), which falls within the course set for the SBTi validated target of a 37% reduction in greenhouse gas emissions by 2030. More specifically, 2023 will see a 17% reduction in Scope 1+2 (market-based) emissions, a 15% reduction in Scope 3 emissions from natural gas sales and a 24% reduction in the carbon intensity of electricity sales (Scope 3 upstream) respectively.
Hera regenerates resources and closes the circle through initiatives and projects in three areas: (i) transition to a circular economy, (ii) sustainable management of water resources, (iii) protection of air, soil and biodiversity.
As regards the transition to a circular economy, 2023 saw sorted waste collection reach 72.2%, up 4.4 percentage points compared to 2022 (Italian 2022 average: 65%) and use of landfills for municipal waste disposal at 2.7% (European 2022 average: 24%). In this respect, Hera is 20 years ahead of the EU target for the circular economy, at the same level as the most virtuous European countries. In October last year, Hera published the fifteenth edition of its Tracking Waste report, verified by DNV, thus providing citizens with a guarantee of the amount of separate waste actually recovered, which came to 89%. This report contains the ranking of the area served by Hera with respect to the recycling targets set by the EU, including the overall recycling rate, where Hera with 61% has already reached the target set for 2030, and the packaging recycling rate, where the Group with 66% has already reached the target set for 2025.
Also concerning the circular economy, 2023 saw:
Regarding the sustainable management of water resources, the initiatives to preserve them were significant, such as the internal water management project, which led to a 21.5% reduction in consumption in 2023 (compared to the 2017 baseline), agreements with local authorities to make water coming out of purification plants reusable, which together with internal and company initiatives brought the portion of purified wastewater available for reuse to 10%, and the aforementioned Consumption Log, which was used by approximately 37.5% of household water service customers.
As far as air protection is concerned, positive results were confirmed in relation to the environmental performance of the Group’s WTE plants, which in 2023 as well recorded very low levels of atmospheric emissions, on average 86% lower than legal limits, and the Imola cogeneration plant, whose average PM10 concentrations were 98% lower than limits. Finally, with regard to soil protection, note that from 2018 to 2023, the construction of infrastructures involved soil reuse coming to 76%.
Significant results were achieved by the Group in 2023 in the CSV areas related to economic growth and employment in the areas served, social inclusion, innovation and digitalisation. Equally important were the initiatives aimed at ensuring the resilience of its operations and therefore of the areas served.
The economic value distributed to local areas came to 2.3 billion euro, or 71% of the total economic value. The portion paid to local suppliers came to 72% of the total and reached 1.4 billion (+61% compared to the previous year), while the induced employment is estimated at over 11 thousand people; these figures confirm the Group’s primary role in promoting growth in the local area. With regard to induced employment, the employment of 962 disadvantaged people as a result of supplies and partnerships with social cooperatives should also be noted, amounting to 92 million euro in 2023. Once again concerning social inclusion, also note the measures introduced by Hera as improvements over those defined by ARERA to support the customers facing hardship: the number of bills paid by instalments increased by 10% compared to 2022, and the memorandums of understanding in place with 138 municipalities in the areas served made it possible to prevent the suspension of supplies to customers assisted by social services in 80% of cases.
In the area of innovation, investments amounting to 142.8 million euro (or 18% of gross operating investments) were related to initiatives in two spheres: ecological transition and digital transformation.
The installation of electronic gas meters continued, reaching 88% of the total at the end of 2023. Installations of the Nexmeter, the electronic gas meter designed by the Group with advanced safety functions, also continued in the Bologna, Modena, Ferrara and Udine areas, reaching 15% of the total number of gas meters. The electricity service, on the other hand, saw a replacement of first-generation electronic meters with more advanced 2G devices, which at the end of 2023 accounted for 42% of total meters (vs 6% in 2022). In the water service, the installation of electronic meters started in 2022 for water-demanding users; at the end of 2023, almost 6,700 electronic meters were installed, amounting to 0.5% of the total and allowing for remote reading of approximately 8% of the volumes sold. Over the time covered by the Plan, installations will continue, bringing the volume sold covered by remote reading to roughly 25% of total volumes sold.
Efforts to develop digital channels for customer relations continued: in 2023, the number of customers registered for online services rose to 36.2%, while those who requested electronic billing reached 40.2%. The Group’s commitment in this area, combined with its focus on local communities, continued in 2023 with the seventh edition of the campaign to promote electronic billing and digital customer behaviour named Digi e Lode, through which the Group from 2017 to 2023 donated 745 thousand euro for the digitisation of 298 schools.
As regards resilience, in 2023 the Group made investments coming to approximately 223 million euro, equivalent to 27% of total gross operating investments. In this regard, note:
Once again regarding the resilience of the services and territories served, the Group provided support to communities affected by the floods that in May 2023 struck 44 municipalities in Emilia-Romagna. This activity involved restoring services as quickly as possible, collecting and disposing of over 70 thousand tonnes of waste as a result of the flooding, implementing the financial measures defined by the government and the regulatory authorities (integrated by the Group) in terms of bill suspension and instalment payments, and supporting the workers affected by the event and engaged in restoration activities through various measures, especially economic initiatives, put in place thanks to measures including solidarity initiatives promoted among all Group workers.
The results achieved in terms of creating shared value complement those in the following areas, which complete the Group’s sustainability profile and are reported in the “Alongside the protagonists of change” section of the Sustainability Report.
Thanks to awareness-raising programmes and the adoption of ISO 45001 certification, which covers 88% of the Group’s workers, the accident frequency index was further reduced (10.2 in 2023) and stood at 39% lower than the sector average measured by Utilitalia. At the end of 2023, 11 Group companies had obtained UNI/Pdr 125:2002 gender equality certification, which now covers 81% of its workers. In 2023, workers received more than 6 million euro through the Hextra welfare system. The amount of training remains high: in 2023, there were 31.5 average hours of training per capita, a further slight increase over the previous year. The role of sustainability goals in the balanced scorecard system linked to incentives for management remained significant. In 2023, 40% of the variable remuneration of Group executives and middle managers was linked to sustainability target projects, with 24% of targets geared towards creating shared value.
In 2023, a further increase occurred in call centre contacts (+15%, roughly 1.3 million more calls) which, as in 2022, was mainly due to turbulence in the energy markets and the impact on bills in the first part of the year. Other aspects that led to an increase in contacts included the end of the protected gas tariff system and the flooding in Emilia-Romagna. Despite these discontinuities, the average waiting time at the residential call centre improved, going from 93 seconds in 2022 to 59 in 2023. The business segment also saw an increase in calls to call centres in 2023 (+10%), but this did not affect the average waiting time, which improved from 112 seconds in 2022 to 72 in 2023. On the other hand, waiting times at counters worsened slightly in 2023 (from 9 minutes in 2022 to 12 in 2023) as a result of inflows that increased by 23% compared to the previous year, for the reasons described above.
The survey carried out in 2023 on the quality of services provided by the Group (approximately 12,021 interviews conducted with residential customers) recorded a 73/100 customer satisfaction index, which thus returned to the level reached in 2021 after the one-point decrease seen in 2022, mainly due to turbulence in the energy markets.
When selecting suppliers in 2023, the Group used the most economically advantageous bid method for 87% of public tenders and 66% of overall tenders (in terms of value). Considering overall tenders, the average score reserved for social and environmental aspects was 39/100. The circular procurement project also continued in 2023, with the application of the appropriate guidelines and the identification of technical criteria providing an advantage in tenders: eco-efficiency, dematerialisation, renewability and recyclability. As in previous years, in 2023 circularity criteria were included in over 92% of the tenders with the most economically advantageous bid, with an average score of 10.2. Supplier monitoring focused on social responsibility towards workers also continued in 2023, as did accident monitoring, which involved 74% (in terms of commissioned value) of the suppliers of services and works. Lastly, note the introduction in 2023 of a new vendor management and supplier qualification system that also assigns a score on the basis of suppliers’ ESG maturity, which can affect the frequency of invitations to tender, and reinforcements in the system for assessing risks along the supply chain in order to more effectively orient control activities.
The Task force on climate-related financial disclosures (TCFD) was established by the G20 Financial stability board following the 2015 Paris Agreement, in which the member states of the United Nations committed to keeping the global average temperature increase below 2°C compared to pre-industrial levels and if possible limit the increase to 1.5°C by the end of the 21 st century. The TCFD, established with the aim of facilitating greater transparency on the financial opportunities and risks associated with climate change, published recommendations in 2017 that still serve as an international reference for corporate climate change disclosure. The TCFD’s recommendations are applicable to organisations across all sectors and are categorised into four areas: governance, strategy, risk management and metrics & targets.
The Group began its path towards alignment with the TCDS recommendations in 2020, and it has been defined according to three main steps:
The EU Taxonomy is a unique EU-wide classification system introduced with Regulation 2020/852, which establishes a list of environmentally sustainable economic activities. This is a classification tool provided for in the Action plan on sustainable finance, aimed at supporting the EU in increasing sustainable investments and implementing the Green Deal.
Following the recommendations of Delegated Regulation 2021/2178, which introduces disclosure requirements for information linked to the taxonomy in NFS, a multi-step process was developed in 2021 to analyse the Taxonomy’s applicability to all of the Group’s consolidated companies. This process was focused exclusively on climate change mitigation and adaptation targets, for which Delegated Regulation 2021/2139 set out a list of activities that contribute substantially to these objectives, and a list of technical screening criteria that these activities must meet in order to be classified as environmentally sustainable. It thus became possible to go beyond the disclosure requirements established for the 2021 NFS and to quantify and report on the economic KPIs (turnover, opex and capex) of the activities managed by the Hera Group that are eligible for the taxonomy, i.e. activities included in the list envisaged in Regulation 2139, as well as those aligned with the taxonomy, i.e. activities that meet the technical screening criteria, as regards the mitigation target. In addition, the economic KPIs were supplemented with Ebitda coming from activities aligned with the taxonomy (which therefore accompanies and complements CSV Ebitda), and the amount of investments in those activities was included in the Business plan.
In 2022, this process continued by refining and updating the analysis of the technical screening criteria, by preparing the reporting in greater detail required for 2022 and with an in-depth study of the complementary delegated act 2022/1214, which introduced certain nuclear and fossil gas energy production activities in the list of eligible economic activities, by defining the technical screening criteria for their alignment.
Lastly, the process continued in 2023 with the analysis of eligible activities and the technical screening criteria defined by Delegated Regulation 2023/2486 concerning four additional environmental objectives (sustainable use and protection of water and marine resources, transition to a circular economy, prevention and reduction of pollution, and protection and restoration of biodiversity and ecosystems) in order to draft the mandatory reporting for 2023. Once again, the analysis made it possible to go beyond the disclosure requirements set out for the 2023 NFS and to quantify and report on the economic KPIs for both eligible activities and those aligned with all six environmental objectives of the Taxonomy. The 2023 NFS also continues voluntarily report on Ebitda coming from taxonomy-aligned activities.
The Sustainability Report can be consulted for a complete discussion of these topics.
An analysis of the operating results achieved in the Group’s business areas is provided below, including: the gas area, which covers services in natural gas distribution and sales, district heating and heat management; the electricity area, which covers services in generation, distribution and sales; the integrated water cycle area, which covers aqueduct, purification and sewerage services; the waste management area, which covers services in waste collection, treatment and recovery; the other services area, which covers services in public lighting and telecommunications, as well as other minor services.

The Group’s income statements include corporate headquarter costs and account for intercompany transactions at arm’s length.
The following analyses of each single business area take into account all increased revenues and costs, having no impact on Ebitda, related to the application of IFRIC 12. The business areas affected by this accounting standard are: natural gas distribution services, electricity distribution services, all integrated water cycle services and public lighting services.
The value of adjusted Ebitda, broken down by strategic business areas, reflects the adjustment to the valuation of gas storage described in the introduction to paragraph 1.04. For a detailed identification of the effects of this adjustment, the values of Adjusted Ebitda and Ebitda are provided below:
| Dec 23 | Dec 22 | |||
|---|---|---|---|---|
| (mn€) | Ebitda* | Ebitda | Ebitda* | Ebitda |
| Gas Area | 516.9 | 609.9 | 585.1 | 491.1 |
| Electricity Area | 309.2 | 309.2 | 71.6 | 71.6 |
| Integrated water cycle Area | 271.4 | 271.4 | 261.9 | 261.9 |
| Waste management Area | 353.4 | 353.4 | 338.0 | 338.0 |
| Other services Area | 43.8 | 43.8 | 38.4 | 38.4 |
| Total | 1,494.7 | 1,587.7 | 1,295.0 | 1,200.9 |
* adjusted results, as described in paragraph 1.04
Gas
A downward trend occurred in 2023 compared to 2022, due to both a reduction in volumes, on account of the mild climate seen in the first part of the year, and lower trading activities, as well as a drop in average prices for energy raw materials. We must recall, in fact, that 2022 was characterised by significant price fluctuations, with a peak recorded in August 2022, followed by a gradual descent starting in December, with an increasingly tendency towards stabilisation during 2023, but with prices still higher than prior to the crisis. Opportunities remained in the energy services segment for energy efficiency incentives, 110% super-bonus and insulation bonuses, and the tenders awarded to Hera Comm Spa in the following lots in Italy:
EBITDA* GAS AREA 2023
|
EBITDA* GAS AREA 2022
|
The following table shows the changes occurred in terms of adjusted Ebitda:
| (mn€) | Dec 23 | Dec 22 | Abs. change | % change |
|---|---|---|---|---|
| Area Ebitda* | 516.9 | 585.1 | (68.2) | (11.7)% |
| Group Ebitda* | 1,494.7 | 1,295.0 | 199.7 | +15.4% |
| Percentage weight | 34.6% | 45.2% | (10.6) pp |
* adjusted results, as described in paragraph 1.04
CUSTOMERS
(k)

The number of gas customers increased by 28 thousand, up 1.3% compared to the previous year. This trend was seen mainly in traditional markets, which rose by 23.9 thousand customers, and to a lesser degree in last resort markets, which showed growth coming to 4.1 thousand customers.
VOLUMES SOLD
(mn/m 3)

Total volumes of gas sold decreased by 2,395.0 million m 3 (-18.3%), mainly due to reduced intermediation, amounting to 1,949.4 million m 3. Volumes sold to end customers also fell by 445.6 million m 3 (-12.4%), a decrease which mainly occurred on traditional markets, coming to 444.8 million m 3 (-14.3%) and, to a much lesser extent, on last resort markets, amounting to 0.9 million m 3 (-0.2%). This trend was affected by both the climatic factors mentioned above, with higher average temperatures compared to the previous year, and lower consumption, linked to the changed habits of the customer base.
The following table summarises operating results for the gas area:
| Income statement (mn€) | Dec 23 | % Inc. | Dec 22 | % Inc. | Abs. change | % change |
|---|---|---|---|---|---|---|
| Revenues | 8,557.1 | 13,483.6 | (4,926.5) | (36.5)% | ||
| Operating costs | (7,936.7) | (92.8)% | (12,780.4) | (94.8)% | (4,843.7) | (37.9)% |
| Personnel costs | (119.9) | (1.4)% | (134.4) | (1.0)% | (14.5) | (10.8)% |
| Capitalised costs | 16.5 | 0.2% | 16.4 | 0.1% | 0.1 | +0.6% |
| Ebitda* | 516.9 | 6.0% | 585.1 | 4.3% | (68.2) | (11.7)% |
* adjusted results, as described in paragraph 1.04
REVENUES
(mn/€)

Revenues decreased by 4,926.5 million euro compared to the previous year. The reasons for this mainly lie in lower sales and brokerage activities totalling 5,304 million euro due to the aforementioned unfavourable weather conditions, lower consumption by the customer base and lower prices for raw materials. Revenues also decreased due to lower activities in Bulgaria and lower district heating volumes totalling 79 million euro. These trends were partially offset by higher revenues related to energy efficiency activities amounting to 413 million euro overall, and higher revenues from IFRIC 12 concession assets and energy efficiency certificates, which on the whole increased by approximately 32 million euro.
Regulated revenues were up by 5 million euro, partially thanks to initial activities in the Udine2 ATEM by AcegasApsAmga Spa. From a regulatory point of view, the regulation of gas distribution and metering (RTDG) was updated for the 2023-2025 three-year period by the Authority’s resolution 737/2022/R/gas.
The drop in revenues was proportionally reflected by operating costs, which showed an overall decrease coming to 4,843.7 million euro. This trend was mainly due to lower sales and trading activities, on account of the lower volumes and the fall in prices for raw materials.
EBITDA*
(mn/€)

* adjusted results, as described in paragraph 1.04
Adjusted Ebitda showed a 68.2 million euro decrease, down 11.7% due to both lower volumes, caused by both the weather and the change in customers’ habits, as mentioned above, and lesser intermediation activities. These were contrasted by the ongoing opportunities grasped in energy services, related to incentivised energy efficiency activities.
NET INVESTMENTS GAS
(mn/€)

In 2023, net investments in the gas area increased by 34.9 million euro compared to the previous year, totalling 190.9 million euro. In gas distribution, an overall increase coming to 20.6 million euro was recorded, 12.1 million euro of which was linked to the investment involving the reimbursement value for plants and networks in complementary municipalities, awarded through the ATEM Udine2 tender, in addition to the increased non-recurring maintenance work on networks and plants and the replacement of metering units for remote management, pursuant to resolution 631/2013/R/GAS.
In gas sales, investments increased by 14.5 million euro due to activities related to the acquisition of new customers. Investments were essentially in line with the previous year in district heating and energy services, and mainly involved the activities of the company Hera Servizi Energia Spa and the work done on district heating networks and plants. Requests for new connections were also up compared to the previous year.
Details of operating investments in the gas area are as follows:
| Gas (mn€) | Dec 23 | Dec 22 | Abs. change | % change |
|---|---|---|---|---|
| Networks and plants | 136.8 | 116.2 | 20.6 | +17.7% |
| Acquisition gas customers | 27.8 | 13.3 | 14.5 | +109.0% |
| DH/Energy services | 27.3 | 27.2 | 0.1 | +0.4% |
| Total gas gross | 191.8 | 156.7 | 35.1 | +22.4% |
| Capital grants | 1.0 | 0.7 | 0.3 | +42.9% |
| Total gas net | 190.9 | 156.0 | 34.9 | +22.4% |
The Regulatory asset base (RAB) for assets owned in the gas area, which defines the value of the assets recognised by the Authority as regards return on invested capital, increased compared to 2022.
RAB
(bn/€)

Electricity
At the end of 2023, significant growth was recorded compared to the previous year, in terms of both volumes sold to end customers thanks to commercial development, mainly on the free market, and margins due to the lower cost of modulation activities, value-added services and innovative offers (relating to electric mobility, photovoltaics, heating and air conditioning). In this regard, note the entry, as of 2023, of the company F.lli Franchini Srl, specialised in the development and installation of high-efficiency photovoltaic systems. In addition, Hera Comm Spa was awarded the following lots nationwide:
EBITDA ELECTRICITY AREA 2023
|
EBITDA ELECTRICITY AREA 2022
|
The following table shows the changes occurred in terms of Ebitda:
| (mn€) | Dec 23 | Dec 22 | Abs. change | Change % |
|---|---|---|---|---|
| Area Ebitda | 309.2 | 71.6 | 237.6 | 331.8% |
| Group Ebitda* | 1,494.7 | 1,295.0 | 199.7 | 15.4% |
| Percentage weight | 20.7% | 5.5% | +15.2 p.p. |
* adjusted results, as described in paragraph 1.04
CUSTOMERS
(k)

The number of electricity customers at the end of 2023 increased by 278.6 thousand, corresponding to a 19.2% increase compared to 2022. This growth occurred mainly in the free market, with roughly 299.5 thousand customers (+22.5%, equivalent to +20.7% of total customers), due to both the reinforced commercial actions implemented and the positive contribution coming from the CONSIP tenders and the gradual protection service, partially thanks to the new lot awarded, as mentioned above, which will supply electricity for micro-businesses. The safeguarded market also grew by 6.2 thousand customers (+29.7%, equivalent to +0.4% of the total) thanks to the additional lot awarded in the tender for 2023-2024. These effects easily offset the drop of about 27.1 thousand customers (-28.6%, equivalent to -1.9% of the total) seen in the protected market.
Customer appreciation and loyalty was confirmed, including the value-added services offered by the Group, which were requested by roughly 88,000 customers during the 12 months of 2023.
VOLUMES SOLD
(GWh)

Volumes of electricity sold increased by 2,315.5 GWh, or 19%, compared to the same period of the previous year. This trend was caused by the increase in volumes sold in the traditional markets in the amount of 2,031.5 GWh (16.7% of the total), from 11,383.0 GWh in 2022 to 13,414.5 GWh in 2023, mainly driven by CONSIP tenders for the free market, which was partially offset by a slight decrease in the safeguarded market. A 284 GWh increase occurred in the safeguarded market, equivalent to 2.3% of the total, due to changes in the scope of operations.
The following table summarises operating results for the gas area:
| Income statement (mn€) | Dec 23 | % Inc. | Dec 22 | % Inc. | Change Abs. change | % change |
|---|---|---|---|---|---|---|
| Revenues | 4,724.0 | 5,042.7 | (318.7) | (6.3)% | ||
| Operating costs | (4,385.9) | (92.8)% | (4,950.9) | (98.2)% | (565.0) | (11.4)% |
| Personnel costs | (59.7) | (1.3)% | (44.0) | (0.9)% | 15.7 | 35.7% |
| Capitalised costs | 30.8 | 0.7% | 23.7 | 0.5% | 7.1 | 29.9% |
| Ebitda | 309.2 | 6.5% | 71.6 | 1.4% | 237.6 | 331.8% |
REVENUES
(mn/€)

Revenues dropped by 318.7 million euro compared to the previous year. This performance was due to lower revenues from sales, brokerage and production coming to 346 million, mainly caused by energy prices, which recorded a 58% drop in the average PUN compared to the previous year. The effect mentioned above was partially offset by higher revenues related to the increase in volumes sold and system charges. The latter, which had been set at zero during the previous year to deal with the energy crisis, were fully restored.
Lastly, higher revenues amounting to 19 million euro were seen for value-added services for customers, and higher revenues for IFRIC 12 concession goods and energy efficiency certificates, up by roughly 8 million euro overall.
The decrease in revenues was more than proportionally reflected in operating expenses, which fell by 565 million euro. This trend was mainly due to the drop in prices for raw materials, thanks to more stability in markets over 2023, which impacted sales and production activities.
EBITDA
(mn/€)

Ebitda increased by 237.6 million euro compared to 2022, mainly due to sales activities, which benefited from the lower impact of modulation and higher volumes sold resulting from the increased customer base both in traditional markets, driven by the free market, and in the safeguarded market, due to the new lot awarded. Activities in value-added services grew, recording an increase in Ebitda coming to about 3 million euro, for reasons including the entry of the company F.lli Franchini, mentioned above, within the Group’s scope of operations.
In the electricity area, investments amounted to 124.5 million euro in 2023, up by 46.2 million euro compared to the previous year.
In electricity distribution, the interventions carried out mainly concerned non-recurring maintenance and upgrading of plants and distribution networks in the Modena, Imola, Trieste and Gorizia areas, as well as the ongoing mass meter replacement, substituting older generation devices with modern 2G meters, and interventions to improve network resilience. These investments were up by 17.6 million euro compared to the previous year.
In energy sales, investments coming to 28.5 million euro were recorded for activities related to the acquisition of new customers. Requests for new connections increased compared to the previous year.
NET INVESTMENTS ELECTRICITY
(mn/€)

Operating investments in the electricity area were as follows:
| Electricity (mn€) | Dec 23 | Dec 22 | Abs. change | % change |
|---|---|---|---|---|
| Networks and plants | 71.7 | 54.1 | 17.6 | +32.5% |
| Acquisition electricity customers | 52.7 | 24.2 | 28.5 | +117.8% |
| Total electricity gross | 124.5 | 78.3 | 46.2 | +59.0% |
| Capital grants | ‐ | ‐ | ‐ | +0.0% |
| Total electricity net | 124.5 | 78.3 | 46.2 | +59.0% |
RAB, which defines the value of the assets recognised by the Authority as regards return on invested capital, increased compared to 2022.
RAB
(bn/€)

Integrated water cycle
In 2023, the integrated water cycle area showed increased results compared to the previous year, with Ebitda coming to 271.4 million euro.
As regards regulations, note that 2023 was the fourth year in which the tariff method defined by the Authority for the third regulatory period (Mti-3), 2020-2023 (resolution 580/2019), was applied. A revenue (VRG) is assigned to each operator, defined on the basis of operating costs and capital costs, according to the investments made, with a view to increasing efficiency in costs, in addition to measures intended to promote and valorise interventions for sustainability and resilience.
In the second half of October 2023, with resolutions 476/2023/R/idr and 477/2023/R/idr, the Authority communicated the results of its analysis of the achievement of contractual quality and technical quality improvement goals by Italian water operators during the 2020-2021 two-year period. In particular, as regards the level of excellence reached in technical quality, which identifies and rewards the top three positions nationwide considering all the macro-indicators defined by the Authority, the Hera Group was awarded first and third place in the general ranking of Italian utilities, confirming the very high quality standards adopted by the Group in managing this service.
EBITDA WATER CYCLE 2023
|
EBITDA WATER CYCLE 2022
|
The following table shows the changes occurred in terms of Ebitda:
| (mn€) | Dec 23 | Dec 22 | Abs. change | % change |
|---|---|---|---|---|
| Area Ebitda | 271.4 | 261.9 | 9.5 | +3.6% |
| Group Ebitda* | 1,494.7 | 1,295.0 | 199.7 | +15.4% |
| Percentage weight | 18.2% | 20.2% | (2.0) pp |
* adjusted results, as described in paragraph 1.04
CUSTOMERS
(k)

The number of water customers increased by 9.9 thousand over 2022, up 0.7%, confirming the moderate trend of internal growth in the Group’s reference areas. The Emilia-Romagna area managed by Hera Spa accounted for 86% of this growth, while the area served by AcegasApsAmga Spa accounted for 9% and the remainder involved the area served by Marche Multiservizi Spa.
The main indicators for the area are as follows:
|
AMOUNT MANAGED 2023
|
AMOUNT MANAGED 2022
|
The volumes supplied through the aqueduct, which amounted to 283.4 million m 3, decreased by 2% compared to December 2022, down by 5.9 million m 3. This trend is partially due to a more aware and efficient us of water resources, with a view to water savings and limiting consumption for the good of the environment. At December 2023, the quantity managed in sewerage came to 232.7 million m 3, down by 2.3% compared to the previous year, while the amount involved in purification settled at 232.2 million m 3, down by 2.3% compared to December 2022. The volumes supplied, following the Authority’s resolution 580/2019, are an indicator of the activity of the areas in which the Group operates and are subject to equalisation, owing to legislation that provides for a regulated revenue, recognised independently from volumes distributed.
ELECTRICITY CONSUMED
(GWh)

Electricity consumed in plants decreased by 9.1 GWh. This drop is related mainly to the Group’s commitment to increasingly efficient and prudent management of energy resources, carried out by implementing innovative measures in plants.
The following table summarises operating results for the gas area:
| Income statement (mn€) | Dec 23 | % Inc. | Dec 22 | % Inc. | Abs. change | % change |
|---|---|---|---|---|---|---|
| Revenues | 1,067.9 | 1,052.6 | 15.3 | +1.5% | ||
| Operating costs | (607.7) | (56.9)% | (611.9) | (58,1)% | (4.2) | (0.7)% |
| Personnel costs | (193.9) | (18.2)% | (185.6) | (17.6)% | 8.3 | +4.5% |
| Capitalised costs | 5.1 | 0.5% | 6.7 | 0.6% | (1.6) | (23.9)% |
| Ebitda | 271.4 | 25.4% | 261.9 | 24.9% | 9.5 | +3.6% |
REVENUES
(mn/€)

Water cycle revenues increased by 1.5% year-on-year, going from 1,052.6 million euro in December 2022 to 1,067.9 million euro in 2023. Note the lower revenues for equalisations of energy components, as described in further detail under operating expenses, and higher accrued tariff revenues related to the increase in RAB. Bonuses were essentially in line with the previous year, reflecting the excellent performances achieved by the Group in terms of quality in managing the integrated water service. Overall, the aforementioned effects account for roughly 5.7 million euro of lower revenues. Lastly, the higher works for contracts carried out in 2023 amounted to approximately 20.0 million euro.
The decrease in operating costs in December 2023 mainly involved lower procurement costs for energy components as a result of an energy scenario with lower prices for raw materials than the previous year. This effect was only partially offset by growth in costs due to the increased works for contracts carried out in 2023. Lastly, note the higher operating costs for the management of networks and plants and the higher costs related to the increase in the list prices of all major supplies of materials and, in particular, chemical products and services.
EBITDA
(mn/€)

Ebitda increased by 9.5 million euro, up 3.6%, going from 261.9 million euro in December 2022 to 271.4 million euro in 2023. Revenues related to the increased RAB were partially offset by higher operating costs, due to factors including higher prices for all main supplies.
In 2023, net investments in the integrated water cycle area amounted to 193.0 million euro, as against 188.1 million euro during the previous year. The overall 4.9 million euro increase was influenced by a rise in capital grants, which reduced net investments more than the previous year. Including the capital grants received, capital expenditures amounted in fact to 228.2 million euro, up 20.2 million euro over the previous year.
These investments mainly referred to extensions, reclamation and upgrades on networks and plants, as well as regulatory adjustments mainly in the purification and sewerage sectors, and amounted to 131.7 million euro in the aqueduct, 58.9 million euro in sewerage and 37.5 million euro in purification.
NET INVESTMENTS WATER CYCLE
(mn/€)

The main interventions include: in the aqueduct, ongoing reclamation activities on networks and connections related to Arera Resolution 917/2017 on the regulation of the technical quality of the integrated water service, as well as major non-recurring maintenance and restoration activities following the May 2023 flood emergency. Important maintenance work continued on the intake works on the Setta stream serving the Sasso Marconi (BO) drinking water treatment plant, the expansion of water networks in other areas served, and the large-scale meter replacement. In addition, development has begun for the project involving the new Castel Bolognese (RA) supply system, and for an important reclamation work on a water adduction pipeline from Pontelagoscuro to Ferrara. In sewerage, in addition to continuing to implement the Rimini seawater safety plan (PSB), maintenance work was carried out to upgrade the sewerage network in other areas served along with work to update drains to comply with Regional Decree no. 201/2016. In purification, note the upgrading on the plant in the municipality of San Giovanni in Persiceto (BO) and the ongoing revamping of the Gramicia purification plant in Ferrara, with the replacement of the sludge centrifuges, as well as the construction of a new “Power to gas” plant at the IDAR purification plant in Bologna. Requests for new water and sewerage connections decreased slightly compared to the previous year. Capital grants, amounting to 35.2 million euro, were down by 15.4 million euro and included 19.5 million euro deriving from the tariff component of the tariff method for the New Investments Fund (FoNI).
Details of operating investments in the integrated water cycle area are as follows:
| Integrated water cycle (mn€) | Dec 23 | Dec 22 | Abs. change | % change |
|---|---|---|---|---|
| Aqueduct | 131.7 | 126.8 | 4.9 | +3.9% |
| Purification | 37.5 | 35.6 | 1.9 | +5.3% |
| Sewerage | 58.9 | 45.5 | 13.4 | +29.5% |
| Total integrated water cycle gross | 228.2 | 208.0 | 20.2 | +9.7% |
| Capital grants | 35.2 | 19.8 | 15.4 | +77.8% |
| of which FoNi (New Investments Fund) | 19.5 | 17.4 | 2.1 | +12.1% |
| Total integrated water cycle net | 193.0 | 188.1 | 4.9 | +2.6% |
RAB, which defines the value of the assets recognised by the Authority as regards return on invested capital, increased compared to 2022.
RAB
(bn/€)

Waste management
In 2023, the waste management area accounted for 23.6% of the Hera Group’s overall Ebitda, with this area’s Ebitda up by 15.4 million euro compared to the previous year. The Group therefore continued to guarantee a significant amount of growth, within a context marked by a slowdown in national GDP and a slightly decelerating inflation rate, with a consequent drop in industrial production and an ensuing impact on waste production, in particular having an industrial origin, where an increase was seen in competitive pressure, including from international companies, in the markets covered.
For 2023 as well, the lines of development that best represent the Group’s activities were confirmed: transforming incoming waste into products with a view to the circular economy, while guaranteeing, at the same time, a correct and rapid management of all types of wastes that, by their very nature, must be disposed of.
One example of this is the new plant in Spilamberto (MO), which became fully operational in 2023. Born out of a partnership between Herambiente and Inalca, it converted an old biodigester into a state-of-the-art plant able to transform organic and agrifood waste into 100% renewable methane and compost. At the Responsible Innovators Awards organised by the Emilia-Romagna Region, this plant received a special mention in the “Ecological Transition” category for its concrete contribution to decarbonisation. With a potential annual production coming to approximately 3.7 million m 3 of biomethane, about 3 thousand TOE (tonnes of oil equivalent) of fossil fuel can be saved and roughly 7 thousand tonnes of CO 2 emissions into the atmosphere avoided.
Protecting environmental resources was confirmed as a priority objective in 2023, as was maximizing their reuse. This is also proven by the special attention the Group dedicated to increasing sorted waste collection. Thanks to the Group’s substantial commitment to this area in all geographical areas served, sorted waste collection increased by more than four percentage points compared to the 2022 figures.
EBITDA WASTE MANAGEMENT AREA 2023
|
EBITDA WASTE MANAGEMENT AREA 2022
|
The following table shows the changes occurred in terms of Ebitda:
| (mn€) | Dec 23 | Dec 22 | Abs. change | % change |
|---|---|---|---|---|
| Area Ebitda | 353.4 | 338.0 | 15.4 | +4.6% |
| Group Ebitda* | 1,494.7 | 1,295.0 | 199.7 | +15.4% |
| Percentage weight | 23.6% | 26.1% | (2.5) pp |
* adjusted results, as described in paragraph 1.04
Volumes marketed and treated by the Group in 2023 are as follows:
| Quantity (k tons) | Dec 23 | Dec 22 | Abs. change | Change % |
|---|---|---|---|---|
| Municipal waste | 2,310.2 | 2,207.1 | 103.1 | +4.7% |
| Market waste | 2,766.9 | 2,554.2 | 212.7 | +8.3% |
| Waste commercialised | 5,077.1 | 4,761.2 | 315.9 | +6.6% |
| Plant by-products | 2,661.0 | 2,161.7 | 499.3 | +23.1% |
| Waste treated by type | 7,738.1 | 6,922.9 | 815.2 | +11.8% |
An analysis of this data shows a rise in waste commercialised, due to increases in both municipal and market. As regards municipal waste, in 2023 a 4.7% rise was see compared to the previous year, mainly due to the waste produced by the flood. For further details, see paragraph 1.03.01, entirely dedicated to the flood.
Market volumes increased by 8.3% compared to 2022, due to the consolidation of previously existing commercial relations, growth in the customer portfolio and recent corporate acquisitions.
Lastly, plant by-products show amounts rising by 23.1% compared to the previous year, mainly due to an increasing in liquid waste caused by the higher rainfall compared to 2022, one of the driest years since these phenomena have been recorded.
SORTED WASTE
(%)

As previously mentioned, sorted municipal waste collection stood at 72.2%, up 4.4 percentage points over the previous year, thanks to the development of projects in the areas managed by the Group.
The Hera Group operates in the entire waste cycle, with 101 plants for treating municipal and special waste and regenerating plastic materials. The main plants include: 9 waste-to-energy plants, 13 composting/digestion plants and 17 selecting plants.
The close attention paid to the set of plants has always been a distinctive element of the Group’s propensity for excellence: operations are indeed ongoing to provide plants with the best available technologies.
WASTE TREATED BY TYPE OF PLANT 2023
|
WASTE TREATED BY TYPE OF PLANT 2022
|
| Quantity (k tons) | Dec 23 | Dec 22 | Abs. change | Change % |
|---|---|---|---|---|
| Landfills | 608.9 | 648.5 | (39.6) | (6.1)% |
| WTE | 1,277.7 | 1,180.2 | 97.5 | +8.3% |
| Selecting plants | 605.6 | 603.8 | 1.8 | +0.3% |
| Composting and stabilisation plants | 502.6 | 490.4 | 12.2 | +2.5% |
| Inertisation and chemical-physical plants | 1,597.5 | 1,405.1 | 192.4 | +13.7% |
| Recovery plants | 120.6 | 113.1 | 7.5 | +6.6% |
| Purification plants | 453.7 | 276.1 | 177.6 | +64.3% |
| Storage/Soil Washing | 230.7 | 145.7 | 85.0 | +58.3% |
| Other plants | 2,340.6 | 2,060.1 | 280.5 | +13.6% |
| Waste treated by plant | 7,738.1 | 6,922.9 | 815.2 | +11.8% |
| Plastic recycled by Aliplast | 84.6 | 79.2 | 5.4 | +6.8% |
Waste treatment showed overall growth coming to 11.8% compared to 2022. An analysis of the individual sectors shows quantities decreasing in landfills while, as regards waste-to-energy plants, the upward trend was mainly due to greater volumes in the Trieste plant, which was revamped in 2022. The increased quantity in sorting plants was due to the greater quantities treated, thanks to the rise in sorted waste collection. In composting and stabilisation plants, volumes increased mainly due to greater quantities treated in the Spilamberto (MO) and Nonantola (MO) plants, fully operational in 2023, while in inertisation and chemical-physical plants, the increased quantities were mainly due to greater volumes of liquid waste treated.
In recovery plants, volumes increased due to a growing demand for high-quality recycled plastic products.
Lastly, an increase in waste treated at purification plants occurred due to greater liquid by-products. In the storage/soil washing sector the increase was mainly caused by changes in the perimeter, while the increase in Other plants was due to greater quantities intermediated at third-party plants, partially on account of flood waste management.
The following table summarises operating results for the area:
| Income statement (mn€) | Dec 23 | % Inc. | Dec 22 | % Inc. | Abs. change | % change |
|---|---|---|---|---|---|---|
| Revenues | 1,737.9 | 1,578.8 | 159.1 | +10.1% | ||
| Operating costs | (1,166.5) | (67.1)% | (1,058.0) | (67.0)% | 108.5 | +10.3% |
| Personnel costs | (244.6) | (14.1)% | (215.8) | (13.7)% | 28.8 | +13.3% |
| Capitalised costs | 26.6 | 1.5% | 33.0 | 2.1% | (6.4) | +(19.4)% |
| Ebitda | 353.4 | 20.3% | 338.0 | 21.4% | 15.4 | +4.6% |
REVENUES
(mn/€)

In 2023, revenues increased by 10.1% compared to the previous year. Note the 132.1 million euro increase in revenues due to changes in the scope of consolidation caused by recent acquisitions in the Industry market, and the higher revenues from disposal coming from increased commercial activities in the utilities market, in terms of both volumes and prices, amounting to approximately 42.2 million euro, partially offset by the drop in prices in the recovery market. Note, furthermore, the approximately 30 million euro in contributions received linked to the flood emergency to cover costs having the same amount.
Operating costs for 2023 grew by 10.3%. Note the higher costs due to both the change in the scope of consolidation compared to the previous year, on account of recent acquisitions, and for transport and treatment services involving by-product management, due to higher volumes and an increase in supplier prices. Decreased costs were also seen for purchasing raw materials due to the drop in commodity prices, while in the treatment market an increase occurred in maintenance costs and consumables, particularly chemicals.
As far as municipal waste collection is concerned, the increased activities were related to developing new sorted waste collection projects.
EBITDA
(mn/€)

The increase in Ebitda was mainly due to the good performance of the treatment area. The contribution coming from changes in the scope of operations due to recent acquisitions amounted to roughly 20.9 million euro, and the excellent performance in energy management came to 15.2 million euro. The positive change resulting from higher volumes treated offset the increases in costs due to inflation, the closure of the Ca’ Lucio landfill in the Marche region and the downward trend in the recovery market.
Net investments in the waste management area were related to maintenance and upgrading on waste treatment plants and amounted to 150.4 million euro, up 2 million euro compared to the previous year.
The composting/digester sector showed a decrease in investments coming to 9.4 million compared to the previous year, linked to the construction in the first part of 2022 of the biomethane production plant in Spilamberto (MO), which created a non-permanent increase in capitalisations for 2022.
Investments in landfills increased by 6.4 million euro, mainly due to the work done by Marche Multiservizi Spa on the fourth lot of the Cà Asprete plant, in addition to the interventions carried out on the Feronia and Galliera plants by Herambiente Spa.
The WTE sector saw an 8.1 million euro decrease in investments, caused by the significant work carried out during the first period of the previous year for revamping line two of the Trieste plant and the planned non-recurring maintenance on the Rimini, Modena and Bologna plants. In the industrial waste plants sector, the 11.7 million euro drop was mainly due to revamping on the Ravenna F3 plant, also carried out in the first part of 2022.
The collection area and equipment sector showed a 1 million euro decrease in investments compared to the previous year, while the sorting and recovery plants sector saw an overall increase coming to 25.4 million euro, due to the perimeter delta caused by the acquisition of A.C.R. Spa and other interventions, including the construction of the rigid plastics processing plant owned by Aliplast Spa.
NET INVESTMENTS WASTE MANAGEMENT
(mn/€)

Details of operating investments in the waste management area are as follows:
| Waste management (mn€) | Dec 23 | Dec 22 | Change Abs. change | % change |
|---|---|---|---|---|
| Composters/digesters | 10.4 | 19.8 | (9.4) | (47.5)% |
| Landfills | 23.7 | 17.3 | 6.4 | +37.0% |
| WTE | 21.9 | 30.0 | (8.1) | (27.0)% |
| SW plants | 16.7 | 28.4 | (11.7) | (41.2)% |
| Collection areas and equipment | 18.1 | 19.1 | (1.0) | (5.2)% |
| Transshipment, selecting and other plants | 59.9 | 34.5 | 25.4 | +73.6% |
| Total waste management gross | 150.8 | 149.2 | 1.6 | +1.1% |
| Capital grants | 0.4 | 0.8 | (0.4) | (50.0)% |
| Total waste management net | 150.4 | 148.4 | 2.0 | +1.3% |
Other services
The other services area covers all minor businesses managed by the Group. Including: public lighting, in which the Hera Group’s efforts go towards planning, constructing and maintaining lighting structures, contributing to safety across the areas served through avant-garde technologies and constant attention towards the circular economy and sustainability; telecommunications, in which the Group offers connectivity for private customers and companies, telephone and Data Centre services through its own digital company; and, lastly, cemetery services. At December 31 2023, results in this area stood at 43.8 million euro, up 5.4 million euro over the previous year.
OTHER SERVICES EBITDA 2023
|
OTHER SERVICES EBITDA 2022
|
The changes occurred in terms of Ebitda are as follows:
| (mn€) | Dec 23 | Dec 22 | Abs. change | % change |
|---|---|---|---|---|
| Area Ebitda | 43.8 | 38.4 | 5.4 | +14.1% |
| Group Ebitda* | 1,494.7 | 1,295.0 | 199.7 | +15.4% |
| Percentage weight | 2.9% | 3.0% | (0.1) pp |
* adjusted results, as described in paragraph 1.04
The following table shows the area’s main indicators as regards public lighting services:
| Quantity | Dec 23 | Dec 22 | Abs. change | % change |
|---|---|---|---|---|
| Public lighting | ||||
| Lighting points (k) | 644.7 | 614.3 | +30.4 | +4.9% |
| of which LED | 45.1% | 40.7% | +4.4 | |
| Municipalities served | 210.0 | 197.0 | +13.0 | +6.6% |
In 2023, the Hera Group acquired approximately 56.3 thousand lighting points in 24 new municipalities. From a geographical point of view, the most significant acquisition included 27.7 thousand lighting points in Tuscany, 7.8 thousand lighting points in Emilia-Romagna, 8.5 thousand lighting points in Umbria, 5.1 thousand lighting points in the Triveneto area and 2.2 thousand lighting points in Lombardy. Also note the acquisitions made in other regions, mainly in central Italy, coming to 5.0 thousand lighting points. The increases seen during the period fully offset the loss of 25.9 thousand lighting points and 11 municipalities served, mainly in the Triveneto area.
The percentage of lighting points using LED lamps also rose, standing at 45.1%, up 4.4 percentage points. This trend highlights the Group’s continued focus on an increasingly efficient and sustainable management of public lighting.
Quantitative indicators in the other services area also include the 6,748 km of proprietary ultra-wideband fibre optic network that the Hera Group owns through its digital company, Acantho Spa. This network serves the main cities in Emilia-Romagna, Padua and Trieste, and provides companies and individuals with high-performance connectivity, high reliability and maximum security for systems, data and service continuity. The network infrastructure became even more extensive in 2023 thanks to the acquisition of Asco TLC Spa, later merged into Acantho. This merger represents a strategic step in the evolution of the Group’s business portfolio and its offer of efficient, innovative and competitive solutions, both in terms of cost and sustainability.
The area’s operating results are provided in the table below:
| Income statement (mn€) | Dec 23 | % Inc. | Dec 22 | % Inc. | Abs. change | % change |
|---|---|---|---|---|---|---|
| Revenues | 192.4 | 196.2 | (3.8) | (1.9)% | ||
| Operating costs | (128.8) | (66.9)% | (139.2) | (71.0)% | (10.4) | (7.5)% |
| Personnel costs | (22.9) | (11.9)% | (21.3) | (10.9)% | 1.6 | +7.5% |
| Capitalised costs | 3.1 | 1.6% | 2.7 | 1.4% | 0.4 | +14.8% |
| Ebitda | 43.8 | 22.7% | 38.4 | 19.6% | 5.4 | +14.1% |
REVENUES
(mn/€)

The decrease in revenues mainly concerned the public lighting business, due to lower energy adjustments on service management fees, as described in further detail under costs, which were only partly reduced by the progress made in energy upgrading works compared to 2022. Telecommunications contributed with a total of 7.3 million euro to higher revenues, due to both increased activities in telephony and connectivity services and the acquisition of Asco TLC Spa.
The decreased costs in the public lighting business were due to lower costs for the energy component of raw materials, affected during the previous year by the significant rise in prices of energy vectors, despite the increased upgrading activities mentioned above among revenues. Consistently with the trend in revenues, an increase was seen in operating costs related to telecommunications.
EBITDA
(mn/€)

Ebitda for the other services area as a whole increased by 14.1%, up 5.4 million euro due to the contribution coming from public lighting and telecommunications.
Net investments in 2023 for the other services area amounted to 13.8 million euro, down 1.5 million euro compared to the previous year.
In telecommunications, 9.8 million euro in investments were made in network and TLC services, up 0.7 million euro. In public lighting, investments were related to maintenance, upgrading and modernisation for lighting systems in the areas managed and came to 4.0 million euro, down 2.2 million euro compared to the previous year.
NET INVESTMENTS OTHER SERVICES
(mn/€)

Details of operating investments in the other services area are as follows:
| Other services (mn€) | Dec 23 | Dec 22 | Abs. change | % change |
|---|---|---|---|---|
| TLC | 9.8 | 9.1 | 0.7 | +7.7% |
| Public lighting and traffic lights | 4.0 | 6.2 | (2.2) | (35.5)% |
| Total other services gross | 13.8 | 15.3 | (1.5) | (9.8)% |
| Capital grants | ‐ | ‐ | ‐ | +0.0% |
| Total other services net | 13.8 | 15.3 | (1.5) | (9.8)% |
| mn€ | notes | 2023 | 2022 |
|---|---|---|---|
| Revenues | 1 | 14,897.3 | 20,082.0 |
| Other operating revenues | 2 | 667.8 | 548.2 |
| Raw and other materials | 3 | (9,672.2) | (16,730.0) |
| Service costs | 4 | (3,655.9) | (2,105.8) |
| Personnel costs | 5 | (641.1) | (601.1) |
| Other operating expenses | 6 | (90.3) | (74.9) |
| Capitalised costs | 7 | 82.1 | 82.5 |
| Amortisation, provisions and depreciation | 8 | (753.7) | (667.1) |
| Operating profit | 834.0 | 533.8 | |
| Share of profits (losses) pertaining to joint ventures and associated companies | 9 | 10.3 | 10.0 |
| Financial income | 10 | 157.1 | 82.2 |
| Financial expenses | 11 | (345.0) | (217.2) |
| Financial operations | (177.6) | (125.0) | |
| Earnings before taxes | 656.4 | 408.8 | |
| Taxes | 12 | (173.2) | (103.5) |
| Net profit for the period | 483.2 | 305.3 | |
| Attributable to: | |||
| parent company shareholders | 441.4 | 255.2 | |
| non-controlling interests | 41.8 | 50.1 | |
| Earnings per share | |||
| basic | 17 | 0.305 | 0.175 |
| diluted | 17 | 0.305 | 0.175 |
Pursuant to Consob Resolution no. 15519 of 27 July 2006, the effects of relationships with related parties are accounted for in the appropriate income statement outlined in paragraph 2.03.01 of this consolidated financial statement.
| mn€ | notes | 2023 | 2022 |
|---|---|---|---|
| Net profit (loss) for the period | 483.2 | 305.3 | |
| Items reclassifiable to the income statement | |||
| Fair value of derivatives, change for the period | 29 | (289.1) | 229.1 |
| Tax effect related to reclassifiable items | 83.2 | (65.9) | |
| Items not reclassifiable to the income statement | |||
| Actuarial income (losses) employee and post-employment benefits | 30 | (2.0) | 3.1 |
| Shareholdings valued at fair value | 26 | 10.9 | (12.1) |
| Tax effect related to not reclassifiable items | 0.4 | (0.7) | |
| Total comprehensive profit (loss) for the period | 286.6 | 458.8 | |
| Attributable to: | |||
| Parent company shareholders | 238.8 | 406.7 | |
| non-controlling interests | 47.8 | 52.1 |
| mn€ | notes | 31 Dec 23 | 31 Dec 22 |
|---|---|---|---|
| ASSETS | |||
| Non-current assets | |||
| Tangible assets | 21,25 | 2,059.3 | 1,984.4 |
| Rights of use | 22,25 | 90.6 | 84.2 |
| Intangible assets | 23,25 | 4,719.6 | 4,417.4 |
| Goodwill | 24,25 | 908.7 | 848.1 |
| Shareholdings | 26,27 | 195.6 | 190.3 |
| Non-current financial assets | 18 | 162.8 | 151.8 |
| Deferred tax assets | 14 | 302.3 | 240.4 |
| Derivative instruments | 29 | 0.3 | 1.0 |
| Total non-current assets | 8,439.2 | 7,917.6 | |
| Current assets | |||
| Inventories | 32 | 631.6 | 995.1 |
| Trade receivables | 33 | 3,586.8 | 3,875.0 |
| Current financial assets | 18 | 90.9 | 77.7 |
| Current tax assets | 13 | 11.4 | 46.0 |
| Other current assets | 35 | 509.3 | 642.5 |
| Derivative instruments | 29 | 478.0 | 1,622.2 |
| Cash and cash equivalents | 18 | 1,332.8 | 1,942.4 |
| Total current assets | 6,640.8 | 9,200.9 | |
| TOTAL ASSETS | 15,080.0 | 17,118.5 |
Pursuant to Consob Resolution no. 15519 of 27 July 2006, the effects of relationships with related parties are accounted for in the appropriate statement of financial position outlined in paragraph 2.03.02 of this consolidated financial statement.
| mn€ | notes | 31 Dec 23 | 31 Dec 22 |
|---|---|---|---|
| NET EQUITY AND LIABILITIES | |||
| Share capital and reserves | |||
| Share capital | 15 | 1,443.0 | 1,450.3 |
| Reserves | 15 | 1,553.8 | 1,692.9 |
| Profit (loss) for the period | 15 | 441.4 | 255.2 |
| Group net equity | 3,438.2 | 3,398.4 | |
| Non-controlling interests | 16 | 313.4 | 246.3 |
| Total net equity | 3,751.6 | 3,644.7 | |
| Non-current liabilities | |||
| Non-current financial liabilities | 19 | 4,421.7 | 5,689.9 |
| Non-current lease liabilities | 22 | 56.8 | 55.1 |
| Post-employment and other benefits | 30 | 88.1 | 92.0 |
| Provisions for risks and charges | 31 | 617.8 | 565.6 |
| Deferred tax liabilities | 14 | 156.9 | 215.7 |
| Derivative instruments | 29 | ‐ | 6.3 |
| Total non-current liabilities | 5,341.3 | 6,624.6 | |
| Current liabilities | |||
| Current financial liabilities | 19 | 890.8 | 650.1 |
| Current lease liabilities | 22 | 24.5 | 21.3 |
| Trade payables | 34 | 2,637.2 | 3,093.1 |
| Current tax liabilities | 13 | 110.2 | 17.1 |
| Other current liabilities | 36 | 1,866.8 | 1,720.0 |
| Derivative instruments | 29 | 457.6 | 1,347.6 |
| Total current liabilities | 5,987.1 | 6,849.2 | |
| TOTAL LIABILITIES | 11,328.4 | 13,473.8 | |
| TOTAL NET EQUITY AND LIABILITIES | 15,080.0 | 17,118.5 |
Pursuant to Consob Resolution no. 15519 of 27 July 2006, the effects of relationships with related parties are accounted for in the appropriate statement of financial position outlined in paragraph 2.03.02 of this consolidated financial statement.
| mn€ | notes | 31 Dec 23 | 31 Dec 22 |
|---|---|---|---|
| Earnings before taxes | 656.4 | 408.8 | |
| Adjustments to reconcile net profit to cash flow from operating activities | |||
| Amortisation and impairment of assets | 8 | 526.2 | 478.6 |
| Allocation to provisions | 8 | 227.5 | 188.5 |
| Effects from valuation using the net equity method | 9 | (10.3) | (10.0) |
| Financial (income) expenses | 10,11 | 187.9 | 135.0 |
| (Capital gains) losses and other non-monetary elements | (8.4) | 41.6 | |
| Change in provision for risks and charges | 31 | (27.7) | (27.8) |
| Change in provision for employee and post-employment benefits | 30 | (11.0) | (12.7) |
| Total cash flow before changes in net working capital | 1,540.6 | 1,202.0 | |
| (Increase) decrease in inventories | 37 | 395.1 | (627.4) |
| (Increase) decrease in trade receivables | 37 | (81.9) | (1,280.7) |
| Increase (decrease) in trade payables | 37 | (513.7) | 727.8 |
| Increase/decrease in other current assets/liabilities | 37 | 429.7 | 252.7 |
| Changes in working capital | 229.2 | (927.6) | |
| Dividends collected | 37 | 15.1 | 13.4 |
| Interest income and other financial income collected | 37 | 77.8 | 41.8 |
| Interest expenses, net charges on derivatives and other financial charges paid | 37 | (193.4) | (128.0) |
| Taxes paid | 37 | (96.6) | (165.9) |
| Cash flow from operating activities (a) | 1,572.7 | 35.7 | |
| Investments in tangible assets | 21 | (242.7) | (225.6) |
| Investments in intangible assets | 23 | (573.1) | (483.9) |
| Investments in subsidiary companies and business units net of cash holdings | 28 | (76.2) | (50.1) |
| Other equity investments | 28 | ‐ | (3.2) |
| Sale price of tangible and intangible assets | 2.6 | 3.3 | |
| (Increase) decrease in other investment activities | 28 | 30.1 | 1.1 |
| Cash flow from (for) investing activities (b) | (859.3) | (758.4) | |
| New issue of long-term bonds | 20 | 614.9 | 2,127.0 |
| Repayments of non-current financial liabilities | 20 | (750.0) | ‐ |
| Repayments and other net changes in financial liabilities | 20 | (908.5) | (47.3) |
| Repayments of leasing liabilities | 20 | (22.4) | (43.4) |
| Acquisition of Interests in consolidated companies | 20 | (0.1) | (10.6) |
| Increase in minority share capital | 20 | 1.9 | ‐ |
| Dividends paid out to Hera shareholders and non-controlling interests | 20 | (239.1) | (219.5) |
| Changes in treasury shares | 15 | (19.7) | (26.7) |
| Cash flow from (for) financing activities (c) | (1,323.0) | 1,779.5 | |
| Increase (decrease) in cash holdings (a+b+c) | (609.6) | 1,056.8 | |
| Cash and cash equivalents at the beginning of the period | 18 | 1,942.4 | 885.6 |
| Cash and cash equivalents at the end of the period | 18 | 1,332.8 | 1,942.4 |
Pursuant to Consob Resolution no. 15519 of 27 July 2006, the effects of relationships with related parties are accounted for in the appropriate cash flow statement outlined in paragraph 2.03.03 of this consolidated financial statement.
| mn€ |
Share capital |
Reserves |
Reserves
derivatives valued at fair value |
Reserves actuarial income (losses) employee benefits |
Reserves share- holdings valued at fair value |
Profit for the period |
Net equity | Non-
controlling interests |
Total |
|---|---|---|---|---|---|---|---|---|---|
| Balance at 1 Jan 22 | 1,459.6 | 1,352.8 | 93.6 | (33.7) | (5.6) | 333.5 | 3,200.2 | 216.6 | 3,416.8 |
| Profit for the period | 255.2 | 255.2 | 50.1 | 305.3 | |||||
| Other components of comprehensive income: | |||||||||
| fair value of derivatives, change for the period | 161.7 | 161.7 | 1.5 | 163.2 | |||||
| actuarial income (losses) employee and post- employment benefits | 1.9 | 1.9 | 0.5 | 2.4 | |||||
| fair value of shareholdings, change for the period | (12.1) | (12.1) | - | (12.1) | |||||
| Overall profit for the period | ‐ | ‐ | 161.7 | 1.9 | (12.1) | 255.2 | 406.7 | 52.1 | 458.8 |
| change in treasury shares | (9.3) | (17.4) | (26.7) | - | (26.7) | ||||
| change in equity investments | (8.6) | 1.2 | (7.4) | (3.2) | (10.6) | ||||
| other movements | 0.2 | 0.1 | 0.3 | (0.1) | 0.2 | ||||
| Allocation of revenues: | |||||||||
| dividends paid out | (174.7) | (174.7) | (19.1) | (193.8) | |||||
| allocation to reserves | 158.8 | (158.8) | ‐ | - | ‐ | ||||
| Balance at 31 Dec 22 | 1,450.3 | 1,485.8 | 256.6 | (31.8) | (17.7) | 255.2 | 3,398.4 | 246.3 | 3,644.7 |
| Balance at 1 Jan 23 | 1,450.3 | 1,485.8 | 256.6 | (31.8) | (17.7) | 255.2 | 3,398.4 | 246.3 | 3,644.7 |
| Profit for the period | 441.4 | 441.4 | 41.8 | 483.2 | |||||
| Other components of comprehensive income: | |||||||||
| fair value of derivatives, change for the period | (212.1) | (212.1) | 6.2 | (205.9) | |||||
| actuarial income (losses) employee benefit reserves | (1.3) | (1.3) | (0.2) | (1.5) | |||||
| fair value of shareholdings, change for the period | 10.8 | 10.8 | - | 10.8 | |||||
| Overall profit for the period | ‐ | ‐ | (212.1) | (1.3) | 10.8 | 441.4 | 238.8 | 47.8 | 286.6 |
| change in treasury shares | (7.3) | (12.4) | (19.7) | (19.7) | |||||
| minority share payments | ‐ | 1.9 | 1.9 | ||||||
| change in equity investments | 2.9 | 2.9 | (3.0) | (0.1) | |||||
| changes in scope of consolidation | ‐ | 56.8 | 56.8 | ||||||
| other movements | (1.3) | (1.3) | (0.6) | (1.9) | |||||
| Allocation of revenues: | |||||||||
| dividends paid out | (180.9) | (180.9) | (35.8) | (216.7) | |||||
| allocation to reserves | 74.3 | (74.3) | ‐ | - | ‐ | ||||
| Balance at 31 Dec 23 | 1,443.0 | 1,549.3 | 44.5 | (33.1) | (6.9) | 441.4 | 3,438.2 | 313.4 | 3,751.6 |
| notes | 31 Dec 23 | 31 Dec 22 | ||
|---|---|---|---|---|
| A | Cash | 18 | 1,332.8 | 1,942.4 |
| B | Cash equivalents | 18 | ‐ | ‐ |
| C | Other current financial assets | 18 | 90.9 | 77.7 |
| D | Liquidity (A+B+C) | 1,423.7 | 2,020.1 | |
| E | Current financial debt | 19 | (411.9) | (563.0) |
| F | Current portion of non-current financial debt | 19, 22 | (524.1) | (108.4) |
| G | Current financial indebtedness (E+F) | (936.0) | (671.4) | |
| H | Net current financial indebtedness (G+D) | 487.7 | 1,348.7 | |
| I | Non-current financial debt | 19, 22, 29 | (1,087.0) | (2,553.0) |
| J | Debt instruments | 19 | (3.391,2) | (3,197.3) |
| K | Non-current trade and other payables | ‐ | ‐ | |
| L | Non-current financial indebtedness (I+J+K) | (4,478.2) | (5.750,3) | |
| M | Total financial indebtedness (H+L) ESMA guidelines 32 - 382 - 1138 | (3,990.5) | (4,401.6) | |
| Non-current financial receivables | 18 | 162.8 | 151.8 | |
| Net financial debt | (3,827.7) | (4,249.8) |
The new 2023-2027 Plan envisages a significant acceleration of growth compared to the previous Plan.
The Hera Group has revised upwards all its five-year targets, first and foremost Ebitda, which is expected to reach 1.65 billion euro in 2027, 355 million more than the 1,295 million seen at the end of 2022, which represents an annual increase of 5.0%.
The Plan to 2027 calls for a sharp increase in investments too, amounting to more than 4.4 billion euro, or approximately 876 million per year.
The guidelines of our new Business Plan are developed according to three strategic pillars: creation of value, sustainable growth, and resilience enhancement, to address the most relevant challenges of the business sectors, with excellence in project planning across all the territories in which we operate.
Our 2027 strategy has been developed to ensure the Group plays a leading role in addressing complex challenges such as climate change, through initiatives supporting the decarbonization process, transition to a circular economy, and enhancing the resilience of essential services we provide in the territory, always looking after to environmental protection, technological evolution, and social cohesion.

Thanks to the three strategic pillars "value creation", "sustainable growth", and "resilience enhancement", we can reaffirm both prudent economic and financial policies and our commitment to corporate development and growth.
Our strategy focuses on creating value through four main growth levers: efficient allocation of capital to investment projects with the best risk-return profiles, expansion of market shares in the businesses we operate in, expansion of the scope through M&A transactions and extraction of synergies or cost efficiencies, including financial ones.
With total EBITDA at 1,650 million euro in 2027, an improvement of 355 million compared to 2022, and the return on invested capital (ROI) at 9.5% in 2027, up from 7.9% in 2022, the return level demonstrates an important increase in value creation, while maintaining our historically conservative risk profile. Indeed, the differential between ROI and weighted average cost of capital (WACC) increases from 2.2% in 2022 to 3.7% in 2027.
As for dividends, we expect a steady annual increase to a coupon of 16 cents in 2027 (+28% from the last dividend paid), with net earnings per share expected to grow by an average of 7% per year. As a result, the total shareholder return (TSR), which takes into account both expected earnings performance and dividend yield , stands at over 12% on average per annum.
Our new strategic plan confirms our important commitment to the circular economy and decarbonisation, consistent with the achievement of the 2030 industrial goals. We want to encourage and support the green transition of the served areas, with concrete initiatives addressed to citizens, public administrations, and industrial customers, making available our extensive plant equipment and the know-how gained in all our business sectors. In parallel, we will continue to generate shared value EBITDA which by 2027 will increase to 64% of the Group's EBITDA, reaching 70% by 2030.
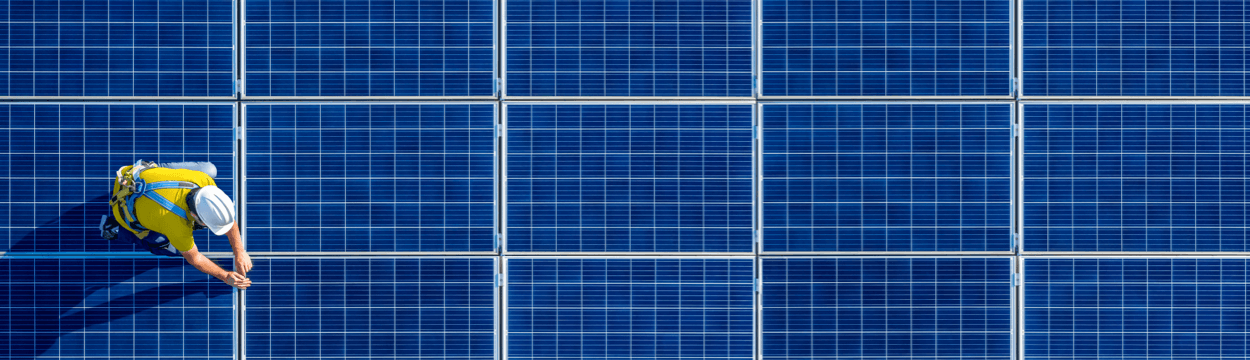
The plan fully confirms our commitment to reduce carbon emissions, with a target of 37% by 2030, already validated by the Science Based Target initiative (SBTi), for both the Group's own emissions and those of our customers, and, in line with this target, we project a 29% reduction as early as 2027. In addition, the planned actions will enable us to reach the 2030 target of increasing the share of renewable electricity in total sales to over 50% three years ahead of schedule. We will also confirm the path outlined to achieve the 2030 targets in the circular economy, such as increasing recycled plastics by +150% compared to 2017 and wastewater reusing up to 18% of the total by 2030.
Finally, we will also promote the green transition with several solutions already in place and new dedicated energy efficiency offers for customers that will allow us to reach 2027 with around 35% of Energy customers with at least one value-added service (VAS) contract subscribed.
The diversified asset management strategy also confirms the focus on strengthening the three main business lines while maintaining the current balance. This balance has ensured the strong resilience of the Group's results in all scenario situations experienced over the last twenty years, as well as a steady and uninterrupted growth of both sustainability targets and economic-financial performance, as well as the high quality of delivered services.
Our business approach is based on a meticulous search for protection from the macro-variables that have become increasingly numerous and volatile. Regulated activities represent approximately 60% of the invested capital as of 2027, thus ensuring regulatory protection against demand cyclicality, inflation, and interest rate movements.
In the remaining 40% of the portfolio, attributable to free market activities, the low-risk strategy is ensured by implementing risk hedging policies in asset management, which have proven particularly effective even in situations of significant commodity price fluctuations experienced over time.
The strategy to 2027 foresees financial resources set aside for investments, increasing by 10% compared to the previous capex plan. Investments coming to 876 m€ every year are planned during the entire 5-years period, to fuel the plant base maintenance and both organic growth and external growth initiatives, including M&A opportunities.

More than 30% of the entire investment plan will contribute to the digitisation and innovation of infrastructures, operations and customer solutions to promote digital transformation, while around 60% will be dedicated to decarbonisation and circular economy, to accelerate the green transition and generate sustainable development in the served areas.
The 4.4-billion-euro investment plan will allocate:
In terms of sustainability, about 70% of total investments are allocated to projects that generate shared value not only for shareholders but for all stakeholders, are aligned with the goals set by the UN Global Agenda for 2030 and support the growth of shared-value EBITDA, bringing it to 64% of Group EBITDA by 2027.
Lastly, it is worth highlighting that approximately 2.5 billion euro of operating investments (or 98% of eligible investments) will be aligned with the European Taxonomy and will therefore be fully eligible for sustainable finance facilitated tools, with a benefit also in terms of financial costs.
The Business plan to 2027 defines the specific objectives the Group outlined to achieve in order to create economic and social value in a sustainable manner and ensure the long-term success of the company.

The projects envisaged in the new Plan by 2027 will make it possible to design a growth trajectory consistent with the targets of the green transition to be achieved by 2030. The targets are measured against industrial indicators that summarise the dimensions of carbon neutrality and the circular economy so that for each one it is possible to verify how the target by 2027 is consistent with the trajectory needed to meet the 2030 targets .
The new industrial plan confirms and strengthens the overall EBITDA growth, reaching 1,650 million euro by 2027, an improvement of 355 million compared to the 2022 figure. Taking into account a number of business opportunities that are not recurrent over the plan period, the growth developed by the Plan reaches 475 million euro, with an average annual rate of 7%.


The 'shared value' EBITDA in 2027 will constitute 64% of the Group's total EBITDA, amounting to 1,049 million euro, to reach 70% in 2030, following a path with a medium- and long-term horizon that generates tangible benefits for the territories and communities served, in parallel with the company's development.
The main objectives of the two dimensions are:
|
|

|
|
Considering the positive preliminary results for 2023, the entire dividend policy has been revised upwards, with the distribution of a dividend of 14 eurocents per share in June 2024, representing a 12% increase compared to the last payout and higher than the growth forecast in the previous Plan (13-eurocents).
The dividend growth rate by 2027 will therefore be higher than that envisaged in the previous Business Plan: in addition to the 1.5 eurocents per share increase in 2023 just mentioned, a further increase of 0.5 eurocents is expected in the following years, reaching 16 eurocents per share in 2027, marking an average annual growth rate throughout the Plan period of +5.1%.

The Business plan to 2027 aims to maintain our strong financial position by continuously monitoring all risk factors and carefully managing cash flows.
Thanks to our solid balance sheet, careful working capital management, and extensive adoption of risk management practices, our financial solidity will enable us to achieve our strategic goals and generate positive operating cash flow. Cumulatively over the five years, the annual cash flow is projected to reach 5.2 billion euros, which will fully finance all investments.
The preliminary 2023 annual results already show a decrease in the Net Debt/EBITDA ratio to <2.6x compared to the 2022 ratio of 3.3x. This positive trend is expected to continue throughout the plan period.

The operating cash flows are further expected to grow, supporting investments, dividends, and M&A expansion, while preserving financial solidity with a Debt/EBITDA ratio of 2.7x by 2027 and leaving room for other investment projects not included in the Plan.


In Hera, values and long-term strategic vision inseparably combine sustainability with a multi-business approach. This confirms and strengthens the “purpose” that guides us, encouraging us to consolidate a strong bond with the communities in which we operate. In addition to offering quality energy, water and waste management services, our mission is to create "Shared Value", i.e. economic value for the company and at the same time for the community and for the areas we serve, with public priorities as our guiding principles. Here, we present a summary of the results achieved and the targets set for the future, not only in terms of creating Shared Value but also to "pursue carbon neutrality”, "regenerate resources and close the loop" and "enable resilience and innovation". For further details, please refer to the Sustainability Report 2023 .

Energy efficiency
Renewable energy development
Climate change mitigation
Circular economy
Waste reduction
Reduction of emissions and carbon footprint
Resilience and adaptation of networks
Sustainable water management
Air protection

Security, quality, cost, and continuity of services provided
Innovation and digital transformation
Human rights in the supply chain
Health and safety at work
Diversity, equality, and inclusion
Training and professional development, compensation and incentives
Local development and social inclusion

Responsible supply chain management
Fight against active and passive corruption
Business ethics
Sustainability management
Risk management
Dialogue with stakeholders
Territorial development
Partnerships with local communities and authorities
Creating value for stakeholders


PURSUING THE CARBON NEUTRALITY
|
ENERGY TRANSITION AND RENEWABLES PROMOTION OF ENERGY EFFICIENCY |
2021 | 2022 | 2023 | 2027 | 2030 |
|---|---|---|---|---|---|
| ISO 50001 energy saving interventions (% savings compared to 2013) 1 |
6.8% | 6.9% | 7.6% | 9% | 10% |
| Gas and electricity household contracts with at least one energy efficiency solution at year end (% of total free market) |
32.1% | 34.3% | 35.7% | 42% | 43% |
| Renewable electricity sold to customers on the free market (% of total volumes sold on the free market) 2 |
45.5% | 40.5% | 42.8% | 56% | >50% |
| Renewable gas produced (GWh) |
75.8 | 72.2 | 80.6 | 184 | 300 |
| CO2 emissions reduction, compared to 2019 with SBTi calculation methodology (%) 3 |
-10.3% | -11.7% | -13.8% | -29% | -37% |
1 Data referring to Hera Spa, Inrete Distribuzione Energia, AcegasApsAmga, Marche Multiservizi, Herambiente, Hestambiente, Herambiente Servizi Industriali and Frullo Energia Ambiente.
2 The final figures for the years prior to the year of reporting have been updated on the basis of the latest Gse data available at the time the financial statements were drawn up. The data does not include AresGas. 2022 figures do not include Eco Gas and Con Energia.
3 Scope 1+2+3 sale of electricity and downstream gas. The Scope 3 data on natural gas sales for 2021 and 2022 do not take into account the transitory increases in emissions related to gas last resort services. The Scope 3 data for methane gas sales for 2021 have been aligned with the calculation methodology used for the 2022 data.
REGENERATING RESOURCES AND CLOSING THE LOOP
|
TRANSITION TO A CIRCULAR ECONOMY SUSTAINABLE WATER RESOURCE MANAGEMENT PROTECTION OF AIR, SOIL AND BIODIVERSITY |
2021 | 2022 | 2023 | 2027 | 2030 |
|---|---|---|---|---|---|
| Sorted waste (%) |
65.3% | 67.8% | 72.2% | 78% | - |
| Plastic recycled by Aliplast (k tonnes ) |
80.9 | 79.2 | 84.6 | 120 | 149 |
| Reusable and reused purified wastewater (% of total purified wastewater) |
6.0% | 7.3% 4 | 10.1% | 13.6% | 18% |
| Water losses (physical and administrative losses in the civil aqueduct) (m3 /km of network/day) |
8.1 | 8.1 | - | 7.4 | - |
| Reduction in internal water consumption, compared to 2017 (%) 5 |
-16.6% | -20.5% | -21.5% | -23.8% | -25% |
| Aqueduct users served in areas with a Water Safety Plan (% of total aqueduct users served) |
22.6% | 61.9% | 65.8% | 91% | 100% |
| Re-use of soil in infrastructure construction (%) 6 |
78% | 78% | 76% | 72% | >80% |
4 Data referring to Hera Spa, AcegasApsAmga and Marche Multiservizi.
5 Data referring to the consumption of water from civil and industrial aqueducts of the Group's most "water-demanding" business units, served by Hera Spa in Emilia-Romagna.
6 Progressive data from 2018.
ENABLING RESILIENCE AND INNOVATING
|
INNOVATION AND DIGITIZATION ECONOMIC DEVELOPMENT AND SOCIAL INCLUSION EMPLOYMENT AND NEW SKILLS DEVELOPMENT RESILIENCE AND ADAPTATION |
2021 | 2022 | 2023 | 2027 | 2030 |
|---|---|---|---|---|---|
| Value of supplies from local suppliers (% of total suppliers) |
67% 7 | 65% 7 | 72% | - | - |
| Workers with permanent contacts (annual average % of total workers) |
96.5% | 96.6% | 95.4% | 97% | 97% |
| Women in roles of responsibility (%) 8 |
30.5% | 31.1% | 32.6% | 33% | >33% |
| Employees with digital proficiency (% of total population) |
49% | 54% | 56% | 75% | 90% |
| Employees with green transition proficiency (% of total population) |
- | 21% | 32% | 53% | 60% |
| Employees with energy transition proficiency (% of total population) |
- | 28% | 36% | 53% | 60% |
| Remote-controlled plants ( thousand ) |
7.9 | 9.0 | 9.7 | 12 | - |
7 Excluding HSE.
8 Executives and middle managers. The percentage of women in the total workforce is 27.5% in 2023.
ALONGSIDE THE PROTAGONISTS OF CHANGE
|
GOVERNANCE PEOPLE CUSTOMERS SUPPLIERS |
2021 | 2022 | 2023 | 2027 | 2030 |
|---|---|---|---|---|---|
| Added value distributed to stakeholders (million euro) |
1,764.4 | 1,674.1 | 2,036.7 | 2,352 | - |
| Average hours of training per capita (number) |
30.3 | 30.8 | 31.5 | ≥26 | ≥26 |
| Accident frequency rate (number of accidents/hours worked x 1,000,000) 9 |
10.3 | 10.5 | 10.2 | ≥10 | <10 |
| Internal climate index (score from 0 to 100) |
71 | - | 70 | ≥70 | ≥70 |
| Customer satisfaction rate, residential customers (score from 0 to 100) 10 |
73 | 72 | 73 | ≥70 | ≥70 |
| Procurement by most economically advantageous bid method: sustainability score (% of total) |
38 | 39 | 39 | ~40 | ~40 |
9 Only injuries with absence greater than or equal to three days.
10 Data for 2021, excluding Marche Multiservizi.
| AGENCY | RATING | COMMENT |
|---|---|---|

|
82
Top 1% |
Hera achieved an overall score of 82/100, which places it in the top 1% globally (43/100 the industry average). Hera also achieved the best score in the environmental and social dimensions |
|
|
16.6
Low Risk |
Hera achieved a score of 16.6, which places it among the lowest ESG risk companies (best European multi-utility). The score improved by +1.6 points compared to 2022 |
|
|
Advanced | Hera was ranked in the Advanced category, preparatory for entry into the Italian Stock Exchange's 'Mib Esg' index, which is based on assessments managed by Vigeo |

|
A | Hera's A rating has been confirmed by MSCI. In particular, the score shows a strong outperfomance in the 'Carbon Emissions' category with a score of 10/10 |

|
A- | In 2023 Hera achieved level A-, an improvement on level B achieved in 2022 |

|
2 nd place | In 2023, Hera was again on the podium for the integration of sustainability policies into its business strategies |
|
Top 100 | In 2023, Hera is once again in the TOP100 in the world in Refinitiv's ranking on the promotion of diversity, inclusion and people development and is the first multi-utility globaly |

|
80.1/100 | With a score of 80.1%, in line with last year and better than the average of both its business sector and the Italian companies assessed by Bloomberg |
|
|
B- Prime | Hera confirmed its B- rating with Prime status, placing itself among the best in the industry. In particular, it ranks first in environmental and social aspects |


Download Center
Virtual Hera: le risposte che cerchi a portata di mano
Ciao sono VHERA, con l'Intelligenza Artificiale Generativa ti aiuto a trovare informazioni su obiettivi e risultati economico-finanziari e di sostenibilità nel sito del Gruppo Hera.
Stiamo aggiornando VHERA coi risultati finanziari e di sostenibilità 2025 del Gruppo Hera. Alcune risposte su questi contenuti sono già disponibili, mentre molte altre fanno ancora riferimento ai materiali 2024: il passaggio ai contenuti 2025 è in corso.
Si invita l'Utente a non inserire dati personali come nome, cognome, indirizzo, numero di telefono, ecc. durante l'interazione. Il chatbot non tratta informazioni personali per fornire una risposta. Lo storico della conversazione viene archiviato per un anno.
VHERA è il Chatbot messo a disposizione da Hera S.p.A., quale provider, sul sito istituzionale www.gruppohera.it per fornire informazioni riguardanti l'area Investor Relator e VCS.
Le risposte fornite da VHERA sono generate tramite sistemi di intelligenza artificiale generativa. In particolare, le risposte fornite dall’assistente virtuale sono elaborate sulla base dei contenuti già disponibili alla consultazione attraverso la normale navigazione del sito. VHERA offre risposte citando o producendo una sintesi del contenuto identificato come più probabile in relazione alle parole inserite nella domanda formulata dall’utente. Ogni risposta contiene il link della pagina utilizzata per la formulazione della risposta. L'obiettivo è offrire risposte utili e pertinenti, ma possono comunque verificarsi casi in cui le risposte risultino incomplete o imprecise.
Pertanto, ti consigliamo di verificare sempre le risposte fornite da VHERA e, se necessario, di proseguire la navigazione sul sito al fine di verificare la pertinenza dei contenuti suggeriti dall’assistente virtuale.
In ogni caso, se noti errori, inesattezze o anomalie nelle risposte, ti invitiamo a segnalarle tramite il feedback: il tuo contributo sarà prezioso per migliorare il servizio.
Le informazioni fornite da VHERA non rappresentano la posizione ufficiale di Hera S.p.A. e non devono essere considerate come consulenza professionale, né utilizzate come base per decisioni importanti. Per conoscere le posizioni ufficiali della Società, ti invitiamo ad utilizzare il canale istituzionale www.gruppohera.it e a fare riferimento alle fonti e alla reportistica ufficiale pubblicata dall'azienda a questi link:
https://www.gruppohera.it/gruppo/investitori/risultati-e-presentazioni/archivio
https://www.gruppohera.it/gruppo/sostenibilita/rendicontazione-di-sostenibilita/csv
Si segnala che nel rispetto delle regole di sicurezza, alcune domande potrebbero non ricevere risposta se non conformi ai criteri impostati.
Per approfondire il funzionamento di VHERA, consulta la Sezione - Scopri come funziona VHERA
VHERA è un chatbot basato su Intelligenza Artificiale Generativa di cui Hera S.p.A. è il provider. Grazie a questa tecnologia, risponde alle tue richieste interrogando i contenuti e i documenti più rilevanti presenti nel sito www.gruppohera.it. Per elaborare le risposte, VHERA prende in considerazione le pagine web e i documenti finanziari e di sostenibilità più recenti, i comunicati stampa degli ultimi due anni, il Codice Etico e altri materiali aziendali di particolare importanza.
Attraverso VHERA puoi approfondire le tematiche di tuo interesse e avere una panoramica aggiornata sulla
comunicazione corporate e istituzionale di Hera S.p.A..
Se invece desideri cercare una specifica informazione sulla gestione delle tue utenze, oppure per tematiche
inerenti il servizio clienti, comunicati stampa o news, puoi utilizzare la navigazione del sito o il motore di
ricerca tradizionale tramite l'icona della lente presente nella testata del sito www.gruppohera.it
Puoi infine fare riferimento alle fonti e alla reportistica pubblicata dall’azienda ai seguenti link:
https://www.gruppohera.it/gruppo/investitori/risultati-e-presentazioni/archivio
https://www.gruppohera.it/gruppo/sostenibilita/rendicontazione-di-sostenibilita/csv
Come ogni sistema basato su intelligenza artificiale generativa, VHERA si impegna a fornire risposte
utili e pertinenti, suggerire fonti ma, basandosi su logiche algoritmiche probabilistiche, può proporre anche
informazioni non pertinenti, incomplete o non del tutto precise: ti consigliamo quindi di verificarle e di
consultare le fonti ufficiali per confermare l'attendibilità delle informazioni ricevute.
Se la richiesta non trova una corrispondenza perfetta nei dati disponibili, VHERA può comunque generare
una risposta sulla base delle informazioni presenti nei propri sistemi: se noti errori o inesattezze, segnalali
tramite l'apposito strumento di feedback per aiutarci a migliorare il servizio.
Ricorda che le informazioni fornite da VHERA non riflettono la posizione ufficiale di Hera S.p.A. e non
sostituiscono la consultazione di documenti istituzionali e ufficiali, soprattutto per decisioni importanti o
questioni rilevanti.
Alcune domande potrebbero non ricevere risposta se non conformi ai criteri di sicurezza impostati; si fa
presente che l'inserimento di informazioni personali non è utile per una risposta del chatbot: ti chiediamo di
non inserire tale tipo di informazioni durante l'interazione con VHERA e di non utilizzare un linguaggio
inappropriato rispetto alle tematiche per cui è prevista l’interazione con l’assistente digitale, o comunque
discriminatorio, offensivo basato su identità, etnia, genere, religione, intimidatorio, riferito a pratiche
sessuali, nudità o contenuti osceni, relativo ad attività illegali.
L’utente si impegna a non:
utilizzare VHERA in qualsiasi modo che possa compromettere la disponibilità o l’accessibilità della stessa o renderla meno efficiente;
eludere o cercare di eludere le misure di sicurezza di VHERA e manomettere la tecnologia su cui l’assistente digitale si basa.
Alcuni suggerimenti utili per parlare con VHERA
Più la domanda è dettagliata e precisa, più VHERA potrà individuare una risposta puntuale e pertinente.
Se desideri cambiare argomento o porre domande su un contesto diverso, ti consigliamo di riavviare la chat attraverso il bottone "Riavvia": questo aiuta il sistema a "ripartire da zero" e a fornirti risposte più coerenti con il nuovo tema.
In caso di risposte errate, poco chiare o che ti sembrano "allucinazioni" del chatbot, puoi riavviare la conversazione con click su "Riavvia" per svuotare la chat e riprovare a porre la domanda in modo diverso.
Se lo strumento non risponde alla domanda o la risposta è incompleta, prova a riformulare la richiesta con termini diversi o a suddividerla in più domande: spesso il dialogo progressivo aiuta VHERA a comprendere meglio le tue esigenze.
VHERA comprende domande poste in quasi tutte le lingue, ma le risposte vengono fornite in italiano.
“AS IS” e “AS AVAILABLE” disclaimer
Il servizio attraverso VHERA è fornito nello stato in cui si trova e senza alcuna garanzia di buon
funzionamento. Pertanto, Hera S.p.A. non è tenuta a rilasciare alcun aggiornamento e non ha alcun obbligo di
eliminare gli eventuali difetti del servizio reso tramite VHERA.
Hera S.p.A. si impegna a fare quanto ragionevolmente possibile per mantenere l’accessibilità e le
funzionalità di VHERA, senza peraltro in alcun modo garantire l’accesso continuo, ininterrotto e sicuro
all’assistente virtuale in questione. Pertanto, Hera S.p.A. non sarà responsabile per qualsiasi disfunzione
nell’accesso o utilizzo di VHERA.
Hera S.p.A. non fornisce alcuna garanzia o impegno, e non rilascia alcuna dichiarazione che l’utilizzo di
VHERA soddisferà le aspettative dell'utente, raggiungerà i risultati previsti dall’utente, funzionerà senza
interruzioni.
Per conoscere le linee guida Hera sull'adozione dell'intelligenza artificiale generativa, consulta il documento:
IL NOSTRO IMPEGNO NELL'UTILIZZO DELL'INTELLIGENZA ARTIFICIALESei sicuro di voler riavviare la chat?
Se vuoi salvare le informazioni puoi copiarla prima di riavviare la conversazione


