FY2021 Results
The results of a multi-business strategy and long-term value creation, rising to tomorrow’s challenges today
Online report Y2021
FY2021 Results
The results of a multi-business strategy and long-term value creation, rising to tomorrow’s challenges today

"In 2021, our commitment to pursuing the creation of value for the company and our stakeholders, with sustainable development, once again enabled us to achieve positive results and implement actions to support the environment in which we operate, starting with our customers"

"The positive results achieved in 2021 show a further reinforcement of the company’s financial solidity, confirmed among other things by the net debt/Ebitda ratio, now at 2.66x, an improvement compared to the previous year."
"In 2021, our commitment to pursuing the creation of value for the company and our stakeholders, with sustainable development, once again enabled us to achieve positive results and implement actions to support the environment in which we operate, starting with our customers.
We will continue to do so in spite of the current scenario, which remains complex, and we look to the future by focusing on two factors that have always distinguished our twenty-year history: concreteness and solidity.
Our decision to increase the dividend to 12 cents per share, in line with what we announced when we presented our new Business Plan, is a step in this direction and will benefit our shareholders, who will be able to count on higher income to face the current difficult situation.
Risk prevention and management, moreover, is one of the strategic guidelines underpinning our Plan; it translates into the medium- to long-term approach required to anticipate actions and thus offset the risks to which utilities are exposed, deal with complexities and continue to guarantee service quality and continuity."
Tomaso Tommasi di Vignano
Executive Chairman
"The positive results achieved in 2021 show a further reinforcement of the company’s financial solidity, confirmed among other things by the net debt/Ebitda ratio, now at 2.66x, an improvement compared to the previous year.
The positive cash flow allowed us to make greater investments, with positive repercussions for the areas in which we operate, in terms of both service quality and the induced economic activity created. Our greater solidity allows us to face the current complex scenario with confidence, continuing to guarantee investments and support for our stakeholders, with sustainability fully integrated into our business strategies.
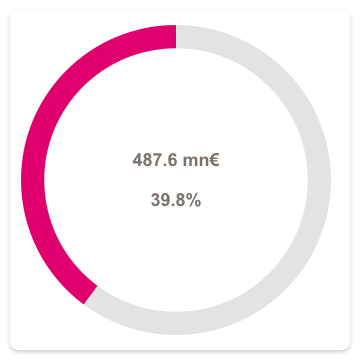
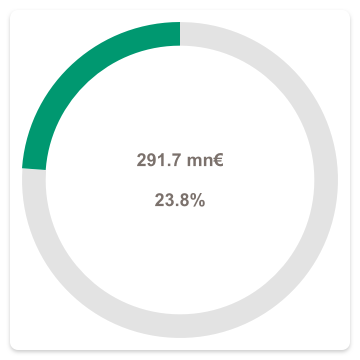
This is confirmed by the increase of over 25% in shared value Ebitda, which rose to 570.6 million in 2021 and accounted for 46.6% of total Ebitda, with the aim of reaching 70% in 2030.”
Stefano Venier
CEO


| M/€ | 2020 | |
|---|---|---|
| Revenues | 7,079.0 | |
| EBITDA | 1,123.0 | |
| Net income | 322,8 | |
| Investments | 528.5 | |
| NFP | 3,227.0 | |
| NFP/EBITDA | 2.87 |

| M/€ | 2021 | |
|---|---|---|
| Revenues | 10,555.3 | + |
| EBITDA | 1,223.9 | + |
| Net income | 372.7 | + |
| Investments | 570.3 | + |
| NFP | 3,261.3 | + |
| NFP/EBITDA | 2.66 |


| Consensus | Hera's results | Δ % | |
|---|---|---|---|
| Ebitda (mln €) | 1,218.5 | 1,223.9 | +0.4% |
| Ebit (mln €) | 629.8 | 611.7 | (2.9%) |
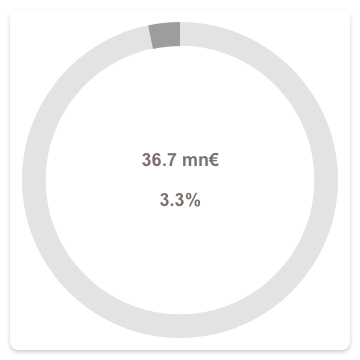
| Net profit post min. (mln €) | 341.3 | 333.5 | (2.3%) |
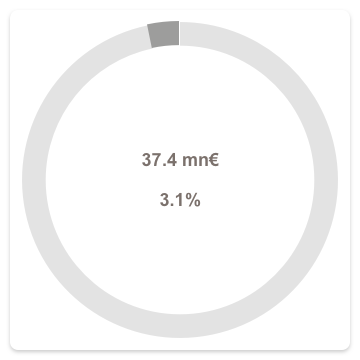
| Net Financial Position (mln €) | 3,364.5 | 3,261.3 | (3.1%) |
| Preview | Post Results | ||||
|---|---|---|---|---|---|
| Analyst | Broker | Rating | Target Price (€) | Rating | Target Price (€) |
| Davide Candela | Banca IMI | Buy | 4.80 | Buy | 4.80 |
| Roberto Letizia | Equita Sim | Hold | 3.90 | Hold | 3.90 |
| Dario Michi | Exane | Buy | 4.85 | Buy | 4.85 |
| Federico Pezzetti | Intermonte | Outperform | 4.30 | Outperform | 4.00 |
| Emanuele Oggioni | Kepler Cheuvreux | Buy | 4.10 | Buy | 4.10 |
| Enrico Bartoli | Stifel (ex MainFirst) | Buy | 4.20 | Outperform | 4.20 |
| Javier Suarez | Mediobanca | Outperform | 4.40 | Outperform | 4.30 |
| Average | 4.36 | Average | 4.31 | ||
| Broker | Analysts' comments on financial results |
|---|---|
| Intesa Sanpaolo | "Hera’s FY21 results were positive and came in broadly in line with our expectations. We highlight the healthy balance sheet figures, with a decreasing trend in cost of debt, 93% fixed rate debt and average duration of more than 7 years, limiting upwards interest rates’ risk." |
| Equita Sim | "No surprises from Hera results which has recently communicated its strategic plan and reported numbers substantially in line with expectations. Our indications are neutral therefore we confirm estimates and recommendations." |
| Exane | "A company you can rely on. Hera has unveiled its Q4 2021 results, which were substantially in line with our estimates at an operative level: EBITDA +8% and EBIT +3% YoY. The net financial position reached EUR 3.26bn, in line with our estimate, with a net debt/EBITDA ratio of 2.66x. Hera is distributing EUR 0.12 p.s. as a dividend on 2021 results. We maintain our valuation range with a minimum target price of EUR 4.50 and a maximum target price of EUR 5.20." |
| Intermonte | "Final full-year numbers have confirmed the excellent operating and financial results presented in January, and despite the current volatile environment the headwinds for the group seem manageable. The group is well placed to benefit from the growth of the Energy supply customer base, its leadership in the Waste business, and a strategy built around the concepts of resilience, risk aversion, and environmental and digital transition. The group is trading at 6.6x 2022E EV/EBITDA, a multiple that we still consider undemanding." |
| Kepler Cheuvreux | "The complete results for 2021 do not come as a surprise after the preliminary release in January. We have raised our WACC by factoring higher country premium risk for Italy, based on internal guidelines. The higher WACC is offset by the rollover of the model to 2023E EBITDA. We have fine-tuned our forecast based on the FY2021 results and we confirm our SOP-based target price of Eur 4.10." |
| Mediobanca | "Hera has reported solid '21 numbers, with a Reported Net Income at €334m (+10%) and the Adjusted Net Income at €320m (+6%). We update our valuation model to reflect the '21 numbers, with an EBITDA +2% above our estimates. In our model, the rolling forward of that growth has been offset by our assumption that the company will have to face higher working capital absorption. As a consequence, we revise estimates by -2% and consequently move our valuation to €4.3/share (was: 4.4/share). We see Hera as a core holding for '22 based on the solidity of its business plan and exposure to secular trends such as the adoption of circular, green and sustainable models in the waste and water businesses. With the stock trading at c8x EV/EBITDA we see value on the stock. Outperform." |


Since the transition to a circular economy is a priority objective, some time ago we defined a circularity strategy which is closely linked to the one aimed at reducing emissions. Not only do they both cut across various sectors and share a strongly business-oriented approach, but a significant amount of the projects linked to the circular economy also contributes directly to an overall reduction in climate-changing emissions.
Year after year, the Business Plan also confirms the circular economy as one of its key levers. Of the 3.8 bn€ in investments defined by the Plan to 2025, about 450 mn€ are reserved for projects dedicated to circularity. In addition, roughly 400 mn€ will go towards further improvement in the sustainable management of water resources, and almost 250 mn€ will be dedicated to the energy transition and renewables.
Reduce, reuse, recycle, recover, regenerate: these 5 Rs guide the development of an increasingly sustainable business model, to reach the targets set out in the Plan to 2025. This will be achieved by focusing on innovation, research, new technologies and synergy between the supply chains of our various businesses. What’s more, in the longer term, these objectives also consistent with the curve that marks our approach to 2030 targets, which calls for us to take action across the board.
The most significant include:
In waste treatment, we will bring packaging recycling to over 80%, even though the EU 2030 target has been set at 70%, and in plastic recycling we aim to reach 150%. We wish not only to increase the production of quality recycled plastics, but also to discourage the use of virgin polymers and eliminate all forms of littering. We will also continue to invest in the production of biofuels, which we obtain from organic waste and used oil, thus powering sustainable mobility.
In the water cycle, in addition to reducing our own consumption and that of our partners, we are increasing the amount of purified wastewater intended for reuse to 15%. This water will, for example, be available in irrigation, thereby promoting sustainability in the agricultural sector as well. Furthermore, thanks to ongoing projects, we will reduce linear network leakage in the water cycle to 9.4 m3/km/day.
In energy, initiatives in the energy transition aimed at contributing to carbon neutrality targets will enable us to meet the ambitious goal of a 37% reduction for the Group and its supply chain, certified by SBTi.
Given that over 90% of Hera’s emissions are produced by the activities of our customers and suppliers, achieving this target will require an effort to be made by everyone. In addition to internal projects, we will propose solutions to promote energy efficiency and introduce initiatives to encourage reduced consumption. We also plan to raise our production of biomethane from MSW to 30 million m3/year and increase the amount of renewable electricity sold, reaching about 50% of total electricity.
These are very specific objectives and we pursue them every day, working as a team and involving all stakeholders, from individual households to large companies, in reducing consumption, encouraging energy efficiency and promoting renewables. All good intentions will thus be transformed into projects and actions capable of generating a value that is concrete, measurable, shared and, most importantly, destined to last.
By 2030, 70% of Group Ebitda will fall under shared value activities and initiatives, confirming the path of growth concerning both the Group and the surrounding ecosystem, by involving all stakeholders and promoting prosperity over the medium and long term.
The projects set out in our new Business Plan, indeed, take into consideration not only further development in the businesses in which we operate, but also promoting the wellbeing of local communities, workers, customers, suppliers and all parties involved.
This is demonstrated by the significant portion of investments, around 66% of the total for 2021-2025, that we have reserved for shared-value projects. We are talking about more than 2.5 bn€, out of the total 3.8 bn€ allocated over the period covered by the Plan, which will allow us to reach the Ebitda/CSV target we have set for ourselves.
Our approach remains the same as always: constant attention to all players involved. This naturally begins with our employees, our most precious resource, who enable us every day to meet the needs of all those who interact with Group companies.
People have a strategic value for us, thanks to their distinctive skills. For this reason, we are investing more and more in an ongoing training strategy, to stimulate innovation, create fertile and open working environments, and bring out the potential of each person, thus making the most of everyone.
In 2021, training activities, reflecting the strategic objectives set out in the Plan, focused on initiatives in areas including the energy transition and the circular economy, health and safety, people engagement and digital proficiency, while continuing to invest in initiatives aimed at strengthening and adapting managerial skills.
In addition to higher investment in training, with 273,000 hours of training provided (30 hours per capita/year, 15% more than in 2020), both the selection and onboarding process and the development process have seen further improvements. This is confirmed by almost 1,800 newly hired employees (+12.5% compared to 2020) and the increased amount of women holding positions of responsibility, now at 30.5%.
Nor should one overlook our commitment to promoting the well-being and safety of workers. A total of 5.3 mn€ has been dedicated to welfare (almost 20% more than in 2020), while the increased measures intended to improve health and safety have contributed to a radical reduction in days of absence due to accidents, which in 2021 fell by 61% (compared to 2013).
These forms of social commitment shown by the Group are recognised by workers themselves, as proven by the internal climate survey carried out last year, in which 82% of the company’s workforce took part and the overall satisfaction rate reached 71/100.
All these indicators show that the growth of people is our driving force. This has been confirmed as a lever by the updated Business Plan to 2025, which identifies several priority KPIs from a “Social” point of view, including personnel management, to support employees in a work environment undergoing profound changes, bill instalment plans, to help customers experiencing economic difficulty, and the value of supplies from local suppliers, to continue giving strong support to the local economy.
Even a highly abstract objective such as “making the world a better place” can become concrete, if applied to an organisational model that allows all stakeholders involved to identify with a purpose closely linked to effective performance and tangible results. In fact, while a company’s mission indicates what it sets out to do, its purpose looks above all towards the meaning of these same actions, and goes beyond its ability, still necessary, to produce profit.
In order to insist on Hera’s commitment towards corporate social responsibility and sustainability, which has always been one of the Group’s distinctive features, in April 2021 the Shareholders Meeting approved the introduction of a “Purpose” into the Articles of Association, i.e. the corporate intentions the Group aims to fulfil in carrying out its business activities.
Article 3 of the amended Articles of Association sums up our values and our goals, while expressing the “social” role we wish to play.
What changes, now that a purpose has been included in Hera’s Articles of Association? On a day-to-day basis, not much, because sustainability and creating shared value have always been fundamental aspects of our company. And yet, it allows us to reiterate even more strongly our commitment to the energy transition, the promotion of social equity and the circular economy through innovation and digitalisation. Furthermore, we are convinced that the principle of “sustainable success” can motivate our employees and get our customers and suppliers involved to a further degree.
In any case, for many years now creating shared value has been a point of reference for us, not only in reporting on our activities but also for in our Business Plan, in order to guarantee sustainable success. The definition of our purpose therefore allows us to orient our strategy in a very precise direction, by including shared value drivers in our Group Remuneration Policy.
Indeed, as of 2021, shared value Ebitda is a parameter used for evaluation in the incentive system involving all executives and managers. Given that variable remuneration is based on achieving objectives, introducing this KPI will further drive us to behave in such a way as to create tangible value inside and outside our organisation. This is important in giving greater strength and concreteness to the corporate values that contribute to further improving our performance, in terms of sustainability as well.
This change in our remuneration and incentive policy came about following a review of our CSV framework, which in its revised version will allow Hera to further strengthen its commitment to creating shared value.
We wish to not only offer a guarantee for the achievement of our “Purpose”, but also to continue being a company capable of “leaving a mark and not a footprint” and incorporating the three areas “Planet, People and Prosperity” into the outlook of its business model itself, acting as the underlying reasons for our development.
With an official price of 3.670 euro on 31 December, Hera stock rose by 22.6%, in line with market performance and countering the trend in the Italian utility index. This rise was supported by the positive response to the publication of quarterly results, which showed solid fundamentals, with profitability growing strongly and exceeding expectations.
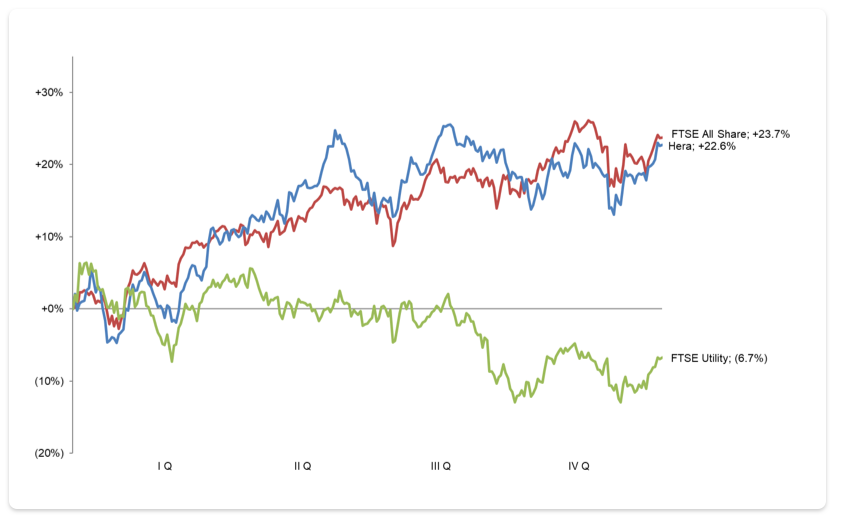
Over the course of 2021, global stock markets performed well as economic activity gradually normalised, thanks to vaccination campaigns and the expansionary fiscal policies implemented on both sides of the Atlantic Ocean. Despite this return to growth, central banks maintained a cautious approach, maintaining their accommodative monetary policies and describing inflationary pressure, due to rising commodity prices, as transitory.
In this context of overall recovery, the Italian FTSE All Share index rose by 23.7% over the period, showing the second-best performance among all main European stock exchanges, thanks to the positive contribution coming from sectors considered to be cyclical, particularly the banking and industrial sectors. On the other hand, sectoral rotation did not reward the more defensive sectors, such as utilities, whose index fell by 6.7%.
With an official price of 3.670 euro on 31 December, Hera stock rose by 22.6%, in line with market performance and countering the trend in the Italian utility index. This rise was supported by the positive response to the publication of quarterly results, which showed solid fundamentals, with profitability growing strongly and exceeding expectations.
On 5 July 2021, Hera’s 19th dividend was paid. The coupon, amounting to 11 cents per share, increased by 10% compared to the previous year, more than the indications contained in the Business Plan, which already incorporated an increase compared to the previous Plan. Hera thus confirms its ability to remunerate shareholders thanks to the resilience of its business portfolio, which has allowed it to distribute steady and growing dividends since its listing.
| euro | 2003 | 2004 | 2005 | 2006 | 2007 | 2008 | 2009 | 2010 | 2011 | 2012 | 2013 | 2014 | 2015 | 2016 | 2017 | 2018 | 2019 | 2020 | 2021 |
|---|---|---|---|---|---|---|---|---|---|---|---|---|---|---|---|---|---|---|---|
| Dps | 0.035 | 0.053 | 0.06 | 0.07 | 0.08 | 0.08 | 0.08 | 0.08 | 0.09 | 0.09 | 0.09 | 0.09 | 0.09 | 0.09 | 0.09 | 0.095 | 0.10 | 0.10 | 0.11 |
The joint effect of continuously remunerating shareholders through dividends and a rise in the price of the stock over the years led the total shareholders return accumulated since the IPO to remain consistently positive and to settle, at the end of the period in question, at over +316.7%.
The financial analysts covering the company (Mediobanca, Stifel, Intermonte, Intesa Sanpaolo, Kepler Cheuvreux and Equita Sim) almost unanimously expressed positive opinions. At the end of the year, the consensus target price came to 4.25 euro, higher than the 3.93 euro recommended at the end of 2020, with a potential increase of 15.8%.
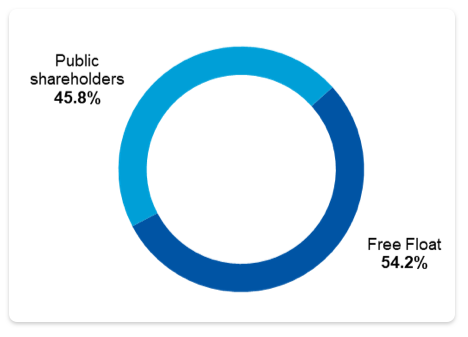
At 31 December 2021, the shareholder breakdown showed its usual stability and balance, with 45.8% of shares belonging to 111 public shareholders located across the areas served and brought together by a stockholders agreement, renewed for three further years and effective from 1 July 2021 to 30 June 2024, and a 54.2% free float. The shareholding structure includes high number of public shareholders (111 municipalities, the largest of which holds shares amounting to less than 10% of the total) and a high number of private institutional and retail shareholders.
Since 2006, Hera has adopted a share buyback program, most recently renewed by the Shareholders Meeting held on 28 April 2021 for 18 further months, for an overall maximum amount of 240 million euro. This plan is aimed at financing M&A opportunities involving smaller companies, and smoothing out any anomalous market price fluctuations vis-à-vis those of the main comparable Italian companies. At the end of 2021, Hera Spa held 29.2 million treasury shares.
The Group continued to engage in intense communications with investors in 2021, during virtual meetings. After Hera’s new 2020-2024 Business Plan was published, the Executive Chairman and the CEO took part in meetings with investors in the main financial centres, to update them on trends in activities and future prospects. Further occasions for contact came about by participating in the sector conferences organised by Borsa Italiana Spa and the brokers covering Hera stock, and organising single meetings requested by institutional investors (video calls and company visits). The intense dedication shown by the Group towards dialoguing with investors and financial analysts, in addition to a selected number of ESG analysts, contributed to reinforcing its market reputation and represents an intangible asset benefiting Hera stock and stakeholders.
As regards the information required by article 2428, paragraph 3, subparagraphs 3 and 4 of the Italian Civil Code, concerning the number and nominal value of the shares constituting the share capital of Hera Spa, the number and nominal value of the treasury shares held as at 31 December 2021, as well as the changes in these shares during 2021, see note 25 of paragraph 3.02.04 and the statement of changes in equity in paragraph 3.01.05 of the Parent Company’s separate financial statements.
Hera makes ongoing efforts to interpret the signs coming from the contexts in which it operates, in an attempt to obtain an overall view of what lies ahead for the Group and its stakeholders. In order to anticipate future developments, the main drivers of change and their essential interrelations are identified below. In particular, the macro-trends of the Group’s reference contexts are described, as are its main management policies, i.e. its industrial strategy and the related sustainability factors (concerning the environment, technology and human capital).
Macroeconomy and finance
The world’s economic and social fabric, damaged by the pandemic that spread globally in 2020, showed increasingly encouraging signs of economic expansion in 2021, boosted by the measures taken by various countries. The most recent estimates formulated by the International Monetary Fund (IMF) for the year show an increase in global gross domestic product coming to 5.9% compared to the previous year. All global economies grew strongly, with advanced economies up by 5.0% and developing economies expected to grow by more than 6.5% year-on-year. From the first available estimates, India and China were the drivers of recovery, with 9.0% and 8.1% growth over 2020; the United Kingdom and the United States grew by +7.2% and +5.6% respectively.
The measures taken to limit the pandemic, and the extraordinary actions implemented by national and international institutions to support the economy, enabled and encouraged recovery in consumption and global trade, despite the presence of some critical points. The new Omicron variant, more contagious than the previous ones, the increase in energy prices and the crisis in the supply of raw materials for industry represented at the end of the year, and still represent, fundamental challenges while continuing along the path of economic recovery that began in 2021.
In the Eurozone, the strong economic expansion seen in the first half of 2021 slowed down sharply in the latter part of the year, mainly due to the new wave of contagions and the ongoing critical situation in supplies of raw materials for businesses, which put manufacturing production under pressure. Overall, 2021 nevertheless proved to be a year of recovery for all European Union countries, with average growth coming to 5.2% according to the most recent IMF estimates. Particularly noteworthy recovery occurred in France (+6.7% vs. 2020) and Italy (+6.2%), followed by Spain (+4.9%) and Germany (+2.7%).
Average inflation for 2021 was around +2.6%. In particular, strong trends were seen since the beginning of the year in inflation, which continued to rise at a sustained pace, especially in the second half of the year, growing by +5% in December 2021 compared to the same month of the previous year, the highest figure since the birth of the European monetary union. The increase in the price of energy, +26% compared to 2020 values, was crucial in this increase. The European Central Bank confirmed the use of the extraordinary interventions linked to the health emergency, including the Pandemic emergency purchase programme or PEPP (1,536 billion euro in public bonds purchased at the end of November) and the Next Generation EU programme, for which the first grants were launched following the approval of the national recovery and resilience plans of EU countries.
The IMF's latest projections for the next two years (published prior to the Russian military intervention in Ukraine) confirm the recovery trend that began in 2021. The global economy is expected to grow by 3.9% in 2022, and 2.6% in 2023. These prospects will occur unevenly across countries: advanced economies are expected to reach pre-pandemic levels of growth as early as 2022, while developing economies may show a more fragile recovery. According to Eurosystem estimates, growth in the euro area is expected to come to +3.9% in 2022 and +2.5% in 2023, overcoming the sharp decline seen in 2020 and returning to 2019 levels as early as the first quarter of 2022.
Unlike the other Eurozone economies, the Italian economy continued to grow in the third quarter of 2021 (+2.6% compared to the previous three months), driven above all by household consumption, while it began to show signs of slowing in the last quarter of the year. According to the Bank of Italy’s initial estimates, GDP grew by about half a percentage point during this quarter; the increase, among the best in the Eurozone, reached 6.2% on an annual basis compared to the previous year. Industrial production grew at a rate of around 1.0% per quarter during the first nine months of 2021, weakening in the latter part of the year. This slowdown, as outlined above, mainly reflects supply difficulties for companies. As regards other indicators, exports and household consumption continued to grow and the labour market showed positive signs: the employment rate stood at 59% in the fourth quarter, up compared to the previous three months.
The IMF’s latest estimates project a 3.8% recovery for Italy in 2022 and 2.2% in 2023. Despite the increase in infections recorded in early 2022, the economy should continue to grow, supported by favourable financial conditions and expansion in world trade.
The rise in inflation mentioned above led the major central banks to review their monetary policies, moving towards a gradual reduction in emergency measures and monetary stimulus. In December 2021, the US central bank (Fed) announced an acceleration of the process of reducing securities purchases, setting its conclusion at March 2022 (instead of June of the same year), following which interest rates are expected to rise again. The Bank of England similarly launched the first post-pandemic increase in its official rate, from 0.10% to 0.25% during 2021, and announced a further rate increase of 0.5% in early 2022. During the past year, the ECB, unlike the US and the UK, confirmed an accommodative stance, but did not rule out higher rates in the future. In March 2022, the PEPP will end as planned, while the quantitative easing programme (i.e. purchases of ordinary securities and reinvestment of maturing securities to prevent liquidity crises) and credit easing operations will continue until at least 2024. Flexibility will remain a key element of European monetary policy: in the event of further pandemic-related market fragmentation, the PEPP will allow for possible reinvestment across asset classes and countries.
The improvement in the economic situation, generated by the strengthened macro-financial framework in 2021 and the upturn in growth prospects for 2022, favoured less use of measures to support access to credit for households and businesses. Liquidity conditions on financial markets are not critical, however the rise in interest rate curves during the year, together with the pressure of inflation and the way and timing of the reduction in monetary accommodation in the main advanced economies, all represent a risk factor for liquidity in the financial markets themselves. In the short term, therefore, risks for domestic financial stability are expected to be moderate, while they are more uncertain in the medium term, should developments be less favourable than expected.
In order to ensure that inflation stabilises at the 2% medium-term target, at its last meeting in February 2022 the ECB confirmed the reference interest rate at zero and the deposit rate as negative (-0.5%), and stated that it was capable of adjusting its instruments where appropriate.
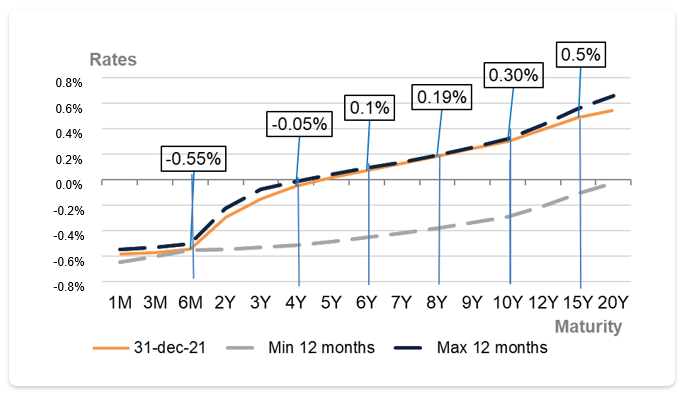
An increase in the interest rate curve of about 50 bps on medium/long-term maturities (swap rates) was seen in 2021, marking a shift from negative to positive rates for maturities above 5 years.
Against this backdrop, conditions in euro area government bond markets did not fluctuate and were characterised by good trading liquidity, partially thanks to the continuation of the ECB’s purchase programmes. Intraday volatility in yields remained moderate on average and the abundant liquidity available, coupled with low transaction costs, supported market activity.
The corporate bond market and supportive monetary and fiscal policy measures allowed for a rapid recovery in bond issuance during 2021, particularly for companies with high credit ratings. Bond issues to finance environmentally sustainable projects (green bonds) and the commitment to environmental, social and governance (ESG) issues continued and became increasingly important criteria for companies’ access to capital markets.
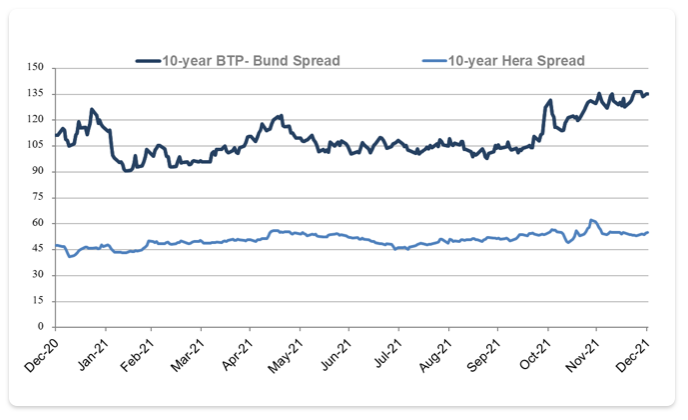
In the last quarter of the year, the sovereign spreads of some countries, including Italy, widened, mainly due to fears that a faster-than-expected reduction in monetary stimulus could be accompanied by the re-emergence of market fragmentation. Spreads on private bonds remained at historically low levels in both the investment grade and high yield segments.
As regards the Group, the spread of its bond portfolio was limited, around 40/60 bps depending on maturity, with a fairly constant trend during the year. Hera’s 10-year spread, shown in the graph below, confirmed the positive trend in the Group’s creditworthiness, always remaining lower than the BTP-Bund spread of the same duration, while showing significantly less volatility.
Note that these forecasts for the development of world economies were drawn up before the Russian military intervention in Ukraine, and will therefore have to be updated by the main international institutes in the coming months. The uncertainties surrounding the direction this conflict will take, and the impact of the economic sanctions imposed on Russia, make it difficult to quantify the effects on the global economy, so it has not been possible to estimate their impact.
Businesses and regulations
The national economic recovery that occurred during the year also affected electricity consumption. The data processed by the national grid operator (Terna) show a total national consumption coming to 318.1 TWh in 2021, up 5.6% compared to 2020. Approximately 87% of energy demand was met by domestic production, 3 percentage points less than in the previous year. This decrease was due to a higher contribution from foreign trading (+32.9% compared to 2020), which saw the combined effect of a fall in exports and an increase in imports.
Net domestic production from renewable sources amounted to 40.9% of the total or 113.8 TWh, in line with 2020, which translated into 36% of consumption met by renewables. Hydropower production remained the main source of renewable energy (39%), even though it was down 2 percentage points compared to the previous year. Wind production, on the other hand, rose by 2 percentage points over 2020, while photovoltaic production (22%), biomass production (16%) and geothermal (5%) remained stable.
According to the initial data processed by the Energy Market Manager (GME), natural gas consumption came to 76.2 billion cubic metres (+8.1% on 2020), the highest amount seen in the last ten years. The upturn in consumption was particularly strong in the spring, which in the same period in 2020 was hard hit by the national lockdown caused by the health emergency. The thermoelectric and civil sectors, which came to 26.0 and 33.4 billion cubic metres respectively, reached their highest levels since 2012, growing by 6.4% and 8.4% respectively compared to the previous year. Consumption in the industrial sector also increased strongly (+6.7%), returning to pre-pandemic figures.
The annual production of urban waste in Italy that emerges from the latest data provided by the Institute for Environmental Protection and Research (ISPRA), relating to 2020, came to 28.9 million tonnes, down 3.6% compared to 2019, and is equivalent to an average per capita production of 489 kg. The reason for the low volume of urban waste produced mainly lies in the effects of the Covid-19 health emergency, in particular the closures of businesses and the travel restrictions implemented several times during the year.
With regard to hazardous waste, ISPRA’s most up-to-date report estimates production at 154 million tonnes in 2020, a 7.3% increase compared to the previous year. The increase is mainly attributable to non-hazardous waste, in particular to waste from construction and demolition operations, which increased by more than 8.5 million tonnes (+14.2%). Roughly 70% of the total production of hazardous waste is due to the construction (45.5%) and waste treatment and remediation (25.1%) sectors, followed by manufacturing (18.9%) and other sectors (approximately 10%).
To date, no information is available on the production of municipal and special waste in 2021, but it is reasonable to assume that the economic recovery seen during the year and the reopening of business activities led to an increase in waste production nationwide compared to 2020.
On the occasion of World Water Day 2021, ISTAT presented its updated report on the national water sector statistics. In Italy, the amount of freshwater withdrawn for drinking stands at just over 9 billion cubic metres, comparable to previous years. This figure once again ranks Italy as the first country in the EU (27) for freshwater withdrawn for drinking from surface or groundwater bodies.
With reference to the uses of water nationwide, according to the Blue Book, 54% of water usage is for agriculture, 21% for industry, 20% for civil use and 5% for energy. This data clearly shows the importance of taking action to encourage water reuse in agriculture and industry.
In 2021, all sectors served by utilities were characterised by strong competition, both with regard to free market and regulated businesses.
As regards the energy market, competition remained very high, concerning both the retail market and tenders in last resort markets. Various players showed a strong interest in the tenders called to eliminate protected electricity services for small and very small businesses. Further evidence of competitive pressure in the retail market can be seen in the high churn rates (source: ARERA) for both electricity and gas sales. Sales companies are increasingly shifting competition towards more complex value-added products (VAS), such as energy efficiency tools (HVAC), combined with the sale of commodities, in order to build customer loyalty and orientate them towards new needs. The healthcare emergency accelerated this change in behaviour shown by customers, who are now increasingly inclined to use digital channels when choosing offers and interacting with service providers. This change has led to a number of sales companies coming onto the market and experimenting with a new way of communicating with customers, based on fully digital relations.
In last resort markets, the interest shown by operators in recent years has led to a gradual drop in margins. In 2021, in particular, tenders were held for assigning Last Resort services in the gas sector (Gas Default and Gas Last Resort Supplier, now called every two years and no longer every year) and in the electricity sector (Safeguarded, with a two-year duration).
As regards waste treatment and recovery, the competitive context now extends across Europe, with large players integrated along the entire reference chain and undertaking plant expansions or aggregations between operators. One example of this is the upcoming merger between the two French giants Veolia and Suez, whose integration will change the current balance between operators in the sector. Within Italy, the industrial waste sector is seeing an increase in investments to expand the treatment capacity of existing plants, as well as the type of waste treated and the integration of activities along the supply chain. In line with this trend, the demand for recycled materials is growing strongly, driven by increasing consumer attention towards sustainable materials, commitments from major international manufacturers to use recycled plastics and European recycling legislation. Market players are responding to these trends by progressively expanding their plant capacity, thereby creating higher competitive pressure than in the past.
Concerning regulated businesses, the Hera Group operates within the market regulated by the Regulatory Authority for Energy, Networks and the Environment (ARERA), which manages and monitors the rules relating to the conditions market access and functioning, as well as compliance with transparency obligations.
During 2021, progress was seen in activities related to tender procedures for awarding contracts for gas distribution, water cycle and waste management services. With regard to the latter business, the management of the Modena and Bologna areas was definitively assigned, with effect from January 2022, and the Hera Group was confirmed as the operator. As regards the gas distribution business, 2021 was also characterised by the small number of tenders actually awarded at a national level. Among these, the main ones were the Milan 1, Turin 1 and 2, Belluno, Naples 1 and Aosta ATEMs (almost all of which are subject to appeal), as well as the Udine 2 ATEM, assigned to the Hera Group (also the outgoing operator). With reference to the areas in which Hera currently provides this service, the process of approving the tender documents for the Forlì-Cesena, Modena 1 and Trieste ATEMs (for which the call was withdrawn) has been completed. As far as the water cycle is concerned, at the end of 2021 the tender for the Rimini province was awarded and a new deadline was set, coming to the end of 2039. In the same year, the concession (which expired at the end of the year) for the water service in the Bologna area was extended to the current operator. Finally, the Authority approved requests for a five-year extension of the service concessions for the Ravenna and Forlì-Cesena areas, the expiry dates of which were postponed from 2023 to 2028.
In regulated businesses, the measures approved in 2021 having the most significance for the Hera Group are as follows:
With a view to the beginning of the second regulatory period of the WACC, by way of resolution 614/2021/R/com, published in late 2021, ARERA adjusted its criteria for determining and updating the rate of return on invested capital for the energy infrastructure sectors (gas and electricity). The new regulatory period will still cover six years (2022-2027) and, in addition to the infra-period update, every three years, it provides for the possibility of an annual update if certain control parameters should undergo significant fluctuations with respect to the values established; resolution 614/2021 therefore formally defines the rates for 2022 only. As a result of the macroeconomic scenario and the performance of the financial markets, WACC was reduced by 70 bps compared to 2021. The remuneration rate for gas distribution went from 6.3% in 2021 to 5.6% in 2022, while WACC for electricity distribution went from 5.9% in 2021 to 5.2% in 2022. The decrease in remuneration rates is essentially due to the abolition of the floor of the risk-free rate, a revision of the country risk hedging portion, the new methodology for the cost of debt and an updated amount of taxation recognised.
In late 2021, with document 615/2021/R/com, Arera initiated consultation for the first methodological guidelines on the new regulation by expenditure and service objectives (Ross). According to ARERA’s outlook, the transition to a regulation that eliminates distortions in the investment choices made by distributors, and increases the overall productivity of infrastructure services, will be gradual and will begin with the application of an initial tariff method referred to as Ross-base. This method will be applied across the board to all operators in infrastructure sectors, with effect from the upcoming regulatory periods (as of 2024 for electricity distribution and as of 2026 for gas distribution). The Ross-base approach will focus on controlling the total expenditure of distributors, setting capitalisation ratios defined by the regulator and extending efficiency to capital costs. Recognition of the capital stock existing at the date of transition to the new criterion will be handled with an overall continuity in the criteria. The more advanced, so-called Ross-integral approach, in addition to including the Ross-base method, will include an analysis of companies’ business plans and an integrated outlook that includes output-based regulation. This advanced approach will be reserved for the electricity transmission operator, the main gas transmission operator and the main electricity distribution operators (with a size threshold yet to be defined) as of 2024.
Regarding the electricity distribution sector, note that, in 2021, ARERA expressed its opinion on the need for a change in the tariff regulation of reactive energy. In its latest consultation document, 515/2021/R/eel, the Authority:
As regards electricity metering, in order to request individual recognition of investments, pursuant to resolution 306/2019/R/eel, note that the electricity distribution companies of the Hera Group, Inrete Distribuzione Energia Spa and AcegasApsAmga Spa, sent their respective 2G electricity meter commissioning plans (Pms2) to Arera in June 2021. These Pms2s illustrate the projected schedules for replacing meters, the expected benefits of the new smart technology and the expenses foreseen. Arera’s preliminary proceedings are currently in progress.
With regard to gas distribution, through resolution 559/2021/R/gas, ARERA intervened on the issue of the effects of decommissioning traditional small-calibre meters. Operators shall be reimbursed for an amount of depreciation for traditional meters that does not consider the time in their useful life when they are decommissioned. The amounts covering the lost depreciation (so-called Irma) are paid to companies in five annual instalments, starting from the 2020 tariff year.
With resolution 512/2021/R/gas, ARERA, at the end of a consultation process that focused, among other things, on reorganising the metering service at delivery points from the transportation network (Remi), approved regulations for the metering service on the natural gas transportation network (Rmtg). Responsibility for metering activities remains in the hands of distributors, and meter reading activities in those of the transmission operator. Minimum and optimum plant, performance and maintenance requirements have been introduced and specific quality levels for the metering service (expressed by specific indicators) and penalty fees have been defined for failure to comply with them. Monitoring service levels is scheduled to start in 2023, while the introduction of penalties for non-compliance is expected for 2024.
In the area of gas distribution, mention should also go to Consultation Document (Dco) 167/2021/R/gas, relating to the Authority’s final guidelines on the reorganisation of measurement at the entry and exit points of the gas transport network, and Dco 250/2021/R/gas, relating to the launch of pilot projects for innovation in gas transport and distribution infrastructures. With the guidelines of the first Dco, Arera aims to ensure that the measurement of gas entering and leaving the transport network will meet predefined standards for accuracy and reliability, through an adequate accountability applied to all players along the chain. To this end, the Authority intends to introduce plant, performance and maintenance requirements for measurement systems, service standards and appropriate incentive mechanisms that translate into financial compensation in the event of non-compliance with the standards. With Dco 250/2021/R/gas, instead, ARERA has outlined procedures for launching pilot projects for testing solutions for optimised management and innovative uses of gas transport and distribution infrastructures, in terms of types of intervention and the subjects involved, general evaluation criteria and coverage of the costs of the trials.
As regards the two-year statute of limitations in the electricity and gas sectors, with resolution 603/2021/R/com, ARERA complied with the rulings of the Lombardy Regional Administrative Court (TAR), providing, as of 2023, for a definitive arrangement of the information flow from distributors to sales companies, in which the distributor, at the same time as making a measurement covering more than two years available through the integrated information system, will also have to communicate to the distribution (UDD) and transport (UDT) Users any causes of non-accrual of the prescription in the cases provided for by the Italian Civil Code (causes not expressly provided for by the previous regulation). Pending upgrades to information systems, which will bring this framework up to standard, a transitional framework is foreseen for 2022 in which the sales company, having received a request for objection to the limitation period from the end customer, shall promptly ask the distributor whether there are any causes for the non-accrual of the limitation period; failure to respond within the next seven working days will be considered a negative response, with the result that the seller will have to waive the now-expired receivable, but will be entitled to claim from the distributor the transportation and conveyance fees, and will also be entitled to participate in the compensation mechanism for settlement charges, as established by resolution 604/2021/R/com. More specifically, in the case of electricity, the charges for financing this mechanism are borne by distributors, unless a distributor can prove a cause for the non-accrual of the two-year statute of limitations; in the case of gas, instead, the charges for financing the compensation mechanism are currently borne by the system, without any economic effect on distributors.
Once again regarding energy sales, by way of resolution 636/2021/R/com ARERA defined procedures for the instalment plan for bills issued in January-April 2022 for household users envisaged by the 2022 Budget Law. These measures cover both safeguarded and free market services and will have to be offered to household electricity and natural gas customers who are in default of payment of their bills issued in the period in question. The instalment plan must be interest-free and provide for an instalment period equal to that of the invoices normally applied, with the first instalment coming to 50% of the amount subject to the instalment plan.
As regards the integrated water service, the main regulatory changes introduced in 2021 concern additions to the regulations governing the metering service, certain changes to technical quality (resolution 609/2021/R/idr) and, with regard to tariff regulations, the criteria and parameters underlying the two-year adjustment valid for 2022-2023 (governed by resolution 639/2021/R/idr). Water metering will be impacted by the introduction of performance indicators relating to the effectiveness of the service (which will serve to increase the performance evaluations of operators by way of a mechanism providing incentives for technical quality), indicators for the introduction of smart meter technologies (currently only used for monitoring purposes), specific standards related to the failure to comply with reading attempts and changeover notices, with some aspects also related to the value of the users’ own readings, in order to meet the service obligations relating to reading attempts, moving towards higher management efficiency. In order to understand the length of the user branches (connections), following a number of appeals and rulings by the State Council, technical quality has also undergone a change in the definition of the indicator of linear network losses (“M1a”).
Among the new rules relating to the two-year adjustment of tariffs for 2022 and 2023, approved by resolution no. 639/2021/R/idr, in addition to a redetermination of the rate of recognition of tax and financial charges (which goes from 5.24% for the two-year period 2020-2021, to 4.8% for 2022 and 2023) note the introduction of a system of incentives or coverage of costs for condominium users (or users grouped under a single centralised meter) that will work towards individualising supply or creating internal divisional meters, with an organised reading process of the same (so-called organised divisionalization). This incentive/coverage of costs will be recognised by the water operator who, in turn, will be compensated through the introduction of a specific tariff component (Opmis).
Lastly, with regard to the water sector, also note resolution 610/2021/R/idr, concerning the two-year limitation period introduced by the 2018 Budget Law for certain types of users, which amends the previous rules and explicitly provides, as for the energy sectors, for the existence of causes for suspending the limitation period (citing Articles 2935 and 2941 of the Civil Code), recalling that the latter must be identified and promptly communicated to the individual user as of 2022 in invoices containing amounts relating to adjustments over two years.
With regard to the integrated waste service, the main regulatory innovation in 2021 concerns the approval of the second tariff method (resolution 363/2021/R/rif, known as Mtr2), which sets out criteria for recognising efficient operating and investment costs for the period 2022-2025, updating the previous method and introducing tariff regulation for treatment, in the case of minimum plants, i.e. those which are essential for closing the cycle (determined by the Regions on the basis of the conditions defined by ARERA), with the sole exclusion of plants that treat the dry portion of sorted waste. This resolution introduces a four-year regulatory period, with annual updates in the tariff parameters. It also introduced the possibility of compensation over a four-year period for costs eligible for recognition that exceed the tariff growth limit (established by the regulation). With specific regard to the tariffs of the treatment plants, the Rab-based rationale previously identified for integrated operators will apply, with tariff methods and incentives for the recovery of materials and energy, similar to those applied to collection companies and integrated operators. A limit on annual growth is also envisaged for the treatment service, based on the amount of planned inflation, but which may be increased by up to 4% per year to take into account the technological and environmental characteristics of the plants. Price signalling to end users is also foreseen, which allow greater benefits for those users of the service who are in contexts in which material and energy recovery plants prevail, and, at the same time, benefits to the communities in the areas surrounding the plants. As far as the rate of return on invested capital is concerned, for the two-year period 2022-2023 the WACC related to collection has been set, at least provisionally, at 6.3% (resolution 459/2021/R/rif). The rate relating to treatment has not yet been defined, although it is expected to be similar to the fundamental parameters underlying the rate for collection, with differences linked to the specific amount of risk in the sector.
Once again concerning the waste sector, two consultation documents were issued during the year, intended to regulate service quality. The latter of these (Dco 422/2021/R/rif) establishes that the first regulatory period (2022-2025) will come into force on 1 January 2023, providing for a set of service obligations in terms of contract quality (uniform rules on activation requests, invoicing, presentation of complaints, etc.) and technical quality (continuity, regularity and safety of the service), together with indicators and general standards. Lastly, future incentive mechanisms (bonuses/penalties) are foreseen.
A timeline showing the main regulatory periods and related measures introduced by ARERA, pertaining to the Group’s sectors of activity, is provided below.
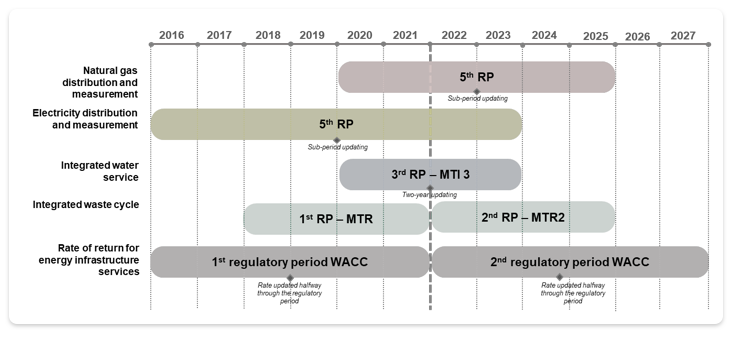
Lastly, the table below indicates the main tariff references for each regulated sector, based on the regulatory framework in effect in 2021 and expected to remain until the end of the current regulatory periods.
|
|
Natural gas distribution and measurement | Electricity distribution and measurement | Integrated water service | Integrated waste cycle |
|---|---|---|---|---|
|
Regulatory period |
2014-2019 2020-2025 |
2016-2019 2020-2023 |
2016-2019 2020-2023 |
2018-2021 2022-2025 |
|
Regulatory governance |
Single level (Arera) |
Single level (Arera) |
Double level (Governmental authority, Arera) |
Double level (Regional authority, Arera) |
|
Invested capital recognised for regulatory purposes (Rab) |
Previous cost revised (distribution) Average between standard and actual cost (measurement) Parametric recognition (centralised capital) |
Parametric recognition for assets until 2007 Previous cost revised for assets as of 2008 |
Previous cost revised |
Previous cost revised |
|
Regulatory lag for investment recognition |
1 year |
1 year |
2 years |
2 years |
|
Return on invested capital (3) |
2019 2020-2021 2022 |
2019-2021 2022 |
2018-2019 2020-2021 +1% for investments as of 2012, covering the regulatory lag 2022-2023 +1% for investments as of 2012, covering the regulatory lag |
2020-2021 +1% for investments as of 2018, covering the regulatory lag 2022-2023 |
|
Recognised operating costs |
Average value of actual costs by company grouping (by size/density), based on 2011 (for revenues until 2019) and 2018 (for revenues as of 2020) (4) Sharing for efficiencies achieved compared to recognised costs Update with price-cap |
Average values of actual sector costs, based on 2014 (for revenues until 2019) and 2018 (for revenues as of 2020) Sharing for efficiencies achieved compared to recognised costs Update with price-cap |
Efficiency-applicable costs: actual amounts for the manager in 2011, adj. for inflation Updatable costs: actual values, with 2-year lag Added charges for specific purposes (previsional) |
Actual costs for manager with 2-year regulatory lag (as of 2020 tariffs for 2018 costs) Added costs for quality improvement and change in manager’s scope (previsional) Balance for 2018-2019 based on 2017 costs (gradual) As of 2022: |
|
Annual efficiency factor for operating costs |
Annual X-factor 2019 As of 2020 |
Annual X-factor 2019 As of 2020 |
Efficiency-applicable mechanism based on: Amount of sharing differentiated according to the discrepancy between actual costs and manager’s efficient cost |
|
|
Incentive mechanisms |
Sharing for net revenues coming from fibre optics transit in electricity grids |
Sharing for electricity costs, based on energy saving achieved. Recognition of 75% earnings from activities aimed at environmental and energy sustainability |
Sharing for revenues coming from sales of materials and energy (range 0.3-0.6) and Conai incentives |
|
|
Annual limit on tariff increases |
Asymmetric, based on:
Possibility of motion guaranteeing economic and financial balance |
Asymmetric, based on the presence of:
Possibility of motion guaranteeing economic and financial balance |
(1) Resolution 443/19 applies to operators in the integrated waste cycle, including treatment activities (disposal or recovery), only if these activities are included in the operator’s corporate scope. The specific measure to be introduced for tariff regulation of compensation for plants falling outside this scope has been postponed.
(2) Resolution 363/21 updated the previous regulatory period and introduced tariff regulation for treatment in the case of minimum plants, i.e. those essential for closing the municipal waste cycle.
(3) For the energy and waste sectors, the WACC methodology is applied, while for the integrated water service the amounts indicated refer to rate of coverage of financial and fiscal charges.
(4) Regarding the significant reduction in the recognition of operating costs introduced by resolution 570/2019 in February 2020, Inrete Distribuzione Energia Spa, the Group’s main distributor, like other operators in the sector, has filed an appeal at the Lombardy-Milan Regional Administrative Court.
Climate and the environment
Regulatory and economic interventions aimed at facing climate change, and the concrete opportunities that derive from taking on the risks linked to it, have become priorities for international and national institutions, as well as those operating in all economic sectors. The Group’s main concerns in pursuing environmental sustainability coincide with the 17 goals on the 2030 Agenda for Sustainable Development (SDGs), as well as the indications contained in the Paris Agreement to limit global warming to below 2ºC, and the long-term climate strategy “A Clean Planet For All” (adopted by the European Union), intended to achieve total decarbonisation by 2050, through carbon neutrality, and to limit the increase in temperature to below 1.5ºC. Further important elements moving in this direction include the change called for by the Green Deal, the European Commission’s plan for a Europe that is more competitive in the fight against climate change and increasingly capable of transforming the economy and society by setting them on a path of sustainable development and, in the wake of this, the circular economy action plan (CEAP). The actions taken by European and national institutions are coordinated and converge towards the objectives of a fair, sustainable and inclusive transition. Adopting the Green Deal and related initiatives, aimed at tackling climate and environmental problems in order to achieve carbon neutrality and the transition to a regenerative and circular growth model, is aimed towards an industrial strategy that implements the circular economy in all sectors.
The circular economy action plan, presented by the Commission last year, has made it possible to outline a strategic framework for circular economic development in the European Union and, in so doing, is geared towards accelerating the transition and making the change envisaged by the Green Deal possible.
Incentive initiatives, reuse and recyclability in products, reduction of overpackaging and rules for bioplastics have become increasingly important in this respect. Above and beyond the plastics sector, the promotion of the circular economy is also encouraged with respect to water management, both in terms of reuse of purified wastewater for irrigation in agriculture and in terms of minimum requirements for the use of reclaimed water.
National policies are being developed in a European context where priorities are defined and available resources are allocated accordingly. In this sense, the National Recovery and Resilience Plan (NRP), which uses the European funds made available by the mechanism included in the NextGenerationEU package, supplemented by a complementary national fund, guides Italy in the implementation phase of the European Green Deal. Since it has highlighted the need to introduce progressively more challenging climate targets, the action plan has been updated with the aim of:
A new push to decarbonise the European economy has been entrusted to the Fit for 55 package, which is still being discussed by the EU institutions. The Fit for 55 package aims, in particular, to increase targets for reducing energy consumption and increasing the penetration of renewable energy in the production mix. In terms of energy efficiency, the current 2030 targets, revised upwards to meet the ambitious emissions reduction target, will be approached thanks to the leading role given to public buildings in the process of improving the efficiency of Europe’s buildings. In terms of renewable energies, the increased production of which is crucial to replacing fossil fuels and reducing carbon intensity, the electrification of consumption will require major investments throughout the supply chain, and the recovery of waste heat from industrial processes will represent a major potential for regional energy planning. The development of renewable gases, a further element of the decarbonisation strategy drawn up at European level, and the development of renewable hydrogen, through the creation of electrolysers powered by renewable energy sources (RES), will also be priorities.
In early 2018, the European Commission published the Sustainable Finance Action Plan, which aimed to respond to three objectives: redirecting capital flows towards sustainable investments in order to achieve sustainable and inclusive growth; managing financial risks arising from climate change, resource depletion, environmental degradation and social issues; and promoting transparency and a long-term vision of economic and financial activities.
The first concrete action took the form of the EU’s own definition of a Taxonomy for sustainable investments, aimed at directing investors’ funds towards sustainable initiatives.
In order to be aligned with this Taxonomy, economic activities must comply with three principles identified by the Regulation:
Moreover, as of 1 January 2022, companies subject to the directive on non-financial reporting will have to indicate the amount of their activities that fall under the European Taxonomy.
The six strategic missions are built around the six pillars of intervention set out in the European Regulation for Recovery and Resilience and are accompanied by specific sectoral reforms. Mission 2, “Green revolution and ecological transition”, the largest in terms of resource allocation, addresses the initiatives that most closely concern the Hera Group.
For the water cycle and waste sector, the NRP aims to modernise networks and plants and reduce the infrastructure gap between the north and south of the country. Among the instruments to be used in this regard, note the central role of the national plan for the water sector, for providing public funding, and the adoption of the national programme for waste management.
In the energy sector, the NRP will focus on developing renewable sources, modernising networks and energy-saving solutions. The main actions include those on networks, to increase their digitalisation and resilience to climate events, the integrated development of the hydrogen chain, including the adaptation of transport and distribution infrastructures, and the principle of energy efficiency such as the first zero-emission fuel.
Over the past few months, the first calls for tenders have been published under the NRP: those pertaining to the Group relate in particular to the circular economy, including the improvement and mechanisation of the urban waste collection network, the construction, modernisation and expansion of treatment plants for urban waste collection, and for absorbent products, wastewater sludge, leather and textile waste, circular economy “flagship” projects relating to collection networks and treatment plants, with particular attention going to strategic supply chains: Waste from electrical and electronic equipment (WEEE), paper and cardboard, plastics and textiles.
Following the Paris Agreement, the EU Commission has required member states to draw up a strategy for reducing greenhouse gas emissions by 2050. Even though this document was published a year later than required by law, it does not yet incorporate the latest Green Deal guidelines. This strategy is aimed at identifying a path of change towards full decarbonisation of the Italian system by 2050, i.e. to intensify actions to increase resilience. The strategy will move towards improving knowledge of climate impacts, intensifying climate risk planning and assessment, accelerating adaptation actions and developing resilience to climate change globally. People are becoming increasingly sensitive to environmental and social inclusion issues and are driving the increase in demand for green & digital interventions, in line with EU recommendations on economic recovery and resilience. In order to get various stakeholders and civil society involved in the adoption of sustainable behaviour, the European Commission has created the European Climate Pact. This initiative offers individuals and organisations opportunities to learn about climate change and find solutions, and provides a space for interaction between individuals and to promote a European climate movement. Organisations can identify their own ambassadors with a focus on gender equality and, in order to support the beginning of concrete actions, the Pact’s platform will make it possible to share experiences, funding opportunities and know-how.
The inevitability of climate change, which has led the European Commission to anticipate its emission reduction targets to 2030, with the hope of achieving full decarbonisation by 2050, is also forcing local authorities to review their priorities and lines of action. Moreover, the pandemic has made it urgent to implement actions to make cities and local programmes more resilient, and has increasingly oriented them towards circular economy initiatives, sustainable mobility, climate adaptation and digitalisation. This scenario is increasingly challenging and offers new opportunities for the utility sector. All types of customers (household, industrial and public administration) will be called upon to introduce technological improvements to reduce their energy needs.
The promotion and sale of energy efficiency products and services, and support for energy efficiency in buildings, are some of the initiatives being promoted.
Stakeholders, both financial and non-financial, who are increasingly oriented towards sustainability issues and, therefore, also towards the sustainability ratings of companies, are increasingly directing financing opportunities towards green products, which are able to raise liquidity on the capital market at rates that are potentially lower than the alternatives.
Following a rationale based on value sharing between companies and communities, oriented towards finding solutions for the benefit of both, the engagement of the community and of individuals is becoming increasingly important. The main megatrends are those that build on the UN 2030 Agenda, theoretical references and successful experiences in shared-value approaches and new business opportunities.
The new lines of development will continue to include the full exploitation of data (seen as a real corporate asset) and a greater focus on cybersecurity, to protect the company and its data. The speed of change makes it essential to define training plans that enable the corporate population to manage change (especially digital change) in the best possible way. This includes, where necessary, training that may be fragmentary but is still able to provide the necessary continuity (self-development).
Technology and human capital
Digital technological evolution involves a continuous acceleration of some major ICT trends and, in addition to moving beyond the paradigms found in economic and social contexts with increasing speed, it alters entire market segments and social relationship patterns. The rise of Artificial Intelligence, automation, Robotic Process Automation, data collection and management (Internet of Things, data governance and data analytics), cybersecurity and, finally, cloud platforms, favours an increase in the amount of data produced and the speed of its availability, generating further opportunities for companies. The Internet of Things and digital interaction between people (exemplified by the automation of more standardised relations with customers through chatbots) make available a continuous and growing flow of data, which allows not only timely diagnoses of different situations (real time analytics), but also a more precise definition of decisions and actions to be taken, often with the support of artificial intelligence. In this direction, the EU Commission has defined the path for an ethical digital development in Europe, with clear targets for 2030 benefiting citizens and businesses, such as: 80% of the adult population with basic digital skills, 75% of businesses favouring the use of cloud computing, big data and artificial intelligence services, more than 90% of small and medium-sized businesses with a basic level of digital intensity, 100% of public digital services available online and 100% of households with gigabit connectivity and inhabited areas covered by 5G. Although Italy is lagging behind other European countries in terms of digitalisation, it is now showing a remarkable improvement over the past. Remote working is an established way of working for 75% of large companies in the public sector and 58% of small and medium-sized enterprises. 13.5 million Spid identities exist, to manage communications to and from public administrations. Italy also ranks third in terms of readiness for 5G. Investments in telecommunications, networks, software, automation and other technological infrastructures, which are essential for reaching European targets, must be accompanied by the spread of an overall approach and training that enables the use of new technologies, which in turn must be oriented towards a sustainable and circular economy, as well as revolving around digitalisation and artificial intelligence. The NRP intends to use 22% of the available funds to give way to a major digital acceleration in Italy, as a lever to give a decisive boost to the country’s competitiveness. Various initiatives aim to encourage migration to the cloud, full interoperability between government data, improvement of the digital services offered to citizens, strengthening of cybersecurity defences, and enhancement of digital skills. This will also be possible thanks to tax incentives for digital transformation (Industry 4.0), contributions for investments in technologically advanced production, coverage of the entire national territory with ultra-wideband networks, and the launch of a reform of the intellectual property system. By virtue of their relationship with the public administration and SMEs, utilities played an important role in supporting digital transformation, in particular through digital services for optimising the yield of production processes, but also through sensors installed for data collection and analysis, without forgetting connected machinery for the automatic performance of tasks and predictive maintenance. Examples of this can be found in the various applications in the businesses in question, such as data-driven energy management solutions, thanks to connected systems and devices equipped with intelligent sensors in public buildings, or smart sensors and devices distributed throughout the territory, coordinated and integrated by digital platforms that process the big data generated for resource planning and service optimisation. The widespread presence of digital technology affects all aspects of business operations, extending changes to the point of translating into additional and new value-added services. The increase in infrastructural needs, which continues to drive the demand for investment in connectivity and remote collaboration tools, for utilities focuses on connection and security needs applied to smart working and also multi-channel interaction with the customer, not to mention the management and sensitisation of infrastructures across the area served. The digitisation process is also fuelled by incremental investments in Artificial Intelligence and hyper-automation, Internet of Things and Internet of Behaviours (IoB), distributed cloud and 5G. Operation technology (OT) or remote management, which had developed over the past few years as a niche area limited to plant effectiveness and with little attention to cyber security aspects, has required companies to increase investments to reduce system fragility. The year 2021 confirmed the growing trend of cybersecurity attacks, both in terms of numbers and severity of impact. In this context, it is essential to continue to deploy all available technological skills and resources to increase the level of protection and attention to cybersecurity risks, in order to counter threats and minimise possible consequences. Customers in all sectors, who are increasingly inclined to interact through digital channels, expect real-time responses and uninterrupted service availability, and therefore reward the most proactive suppliers in terms of attention to behaviour and optimisation of consumption, but also, increasingly, additional services such as smart house and e-mobility.
Cloud platforms have made high-performance connectivity available and enabled significant infrastructural economies of scale for exponential technology development, optimising the use of time to the utmost. The availability of processing power also drives the spread of Artificial Intelligence and Robotic Process Automation applications with integrated Artificial Intelligence (IRPA), which are useful for making the most appropriate decisions on actions to be taken. The identification and formalisation of operational processes that combine human and automated activities, balancing them according to the value added to the process, is therefore one of the issues to which all organisations will have to pay particular attention, not only in terms of organisational design, but also from the point of view of training and operational monitoring.
The enhancement of the human component is also fundamental for a balance between technology and people, focusing the organisation of resources on value-added activities, according to a pattern of intelligent integration, which is not limited to mere cost efficiency and mere replacements, but rather fits into the broader horizon of the Just Transition targeted by the European Union. The current historical moment and the health emergency have emphasised the need to address the priorities towards which corporate culture, leadership styles and models must be directed. The strong acceleration of the digital transformation and the progressive technological literacy of people confirm the need for an increasingly sensitive approach to relational aspects. When dealing with the consolidation of remote working, therefore, the ability of companies to develop distinctive and inclusive communities will be a critical factor in their success, and this consolidation will reduce the risk of weakening the relational capital resulting from an irrational use of remote working. The digital workplace transformation and the interconnection on a single platform allow people to interact, share information and gain knowledge and skills. However, World Economic Forum research in the energy and utilities sector shows that 11.8% of workers are at risk of redeployment, with only 51% of them successfully re-employed. The emerging roles on which to focus training investments will depend on skills related to the digital transformation, the energy transition (with a focus on decarbonisation and renewable energy), the environmental transition (with a focus on circular economy, climate change and green finance) and, last but not least, problem solving and self-management, thus underlining the increased importance of “soft skills”. The technological capacity to acquire huge amounts of data makes it even more important to invest in the human capacity to read it and make it “speak”, so that it can generate the expected value. At the same time, while the increasingly pervasive adoption of tools for remote collaboration has created a change in the way of working and measuring performance, the ability to offer an environment that is also connected in terms of human relations becomes, precisely for this reason, sought after and appreciated. The diffusion of performance management skills, necessary to ensure the achievement of objectives in a context where working time becomes a less and less important factor than the result, has proved to be crucial. Employer branding will also be fundamental in attracting and retaining talent; engagement and inclusion, interconnected by the idea that each person should be valued and encouraged to express their potential, are paramount in maximising performance.
In order to generate value for people, it seems increasingly necessary to move towards structured data governance and to develop sustainable and circular behaviour. Enabling experiences and paths in training and development that are increasingly defined by a rationale of individual and collective responsibility will make it possible to face future scenarios that are changing and not always predictable. Flexible organisational models used to increase agility and resilience, individual empowerment actions, accompanied by a rethinking of working methods, the reinterpretation of space and time, and the well-being of people, are therefore drivers for the enhancement of human capital and, in so doing, work towards increased productivity. In this respect, the creation of fair and inclusive environments is essential for the responsible financial community, and the commitment to promoting policies of inclusion and protecting diversity must increasingly translate into a fight against discrimination in the workplace.
Scenario analysis is a methodology for defining useful inputs for strategic plans to increase the effectiveness of a business model over time.
This type of analysis involves a process aimed at testing a strategy’s resilience under different assumptions describing possible future states. For the Hera Group, it is essential to analyse the potential impact, positive or negative, of various economic-financial, business, regulatory, competitive, environmental, technological and human capital scenarios that are different from each other, but equally plausible and internally consistent.
The study of scenarios has also been applied to climate change, in order to understand how physical and transitional climate opportunities and risks may plausibly affect the business and its areas over time.
The reference framework within which the Group’s strategy has been developed in the various areas consists of three areas:
Macroeconomy and finance
The debt structure towards which the Hera Group is oriented is geared towards its business needs, not only in terms of the duration of loans, but also in terms of interest rate exposure. The Group’s financial strategy, in turn, is risk-adjusted and aimed at maximising its return profile while maintaining a prudent risk strategy.
The scenario projected in the Plan includes an increase in the variable-rate portion over the short term and in the fixed-rate portion over the long term; in this sense, it shows that the Group’s financial structure will reach 72% of fixed rate borrowing in 2025, respecting the limits of its financial risk policy. These projections are part of a careful long-term planning for the necessary financial resources, which Hera carries out by analysing and monitoring cash flows, and paying close attention to its debt structure. The average cost of debt, in particular, is constantly improved, both through financial risk management, which include the use of derivative instruments, and the evaluation of liability management operations aimed at seizing favourable market opportunities. Over the period covered by the plan, the average cost of debt is expected to decrease by approximately 0.3%. Over this five-year period, no significant amounts are expected to fall due, guaranteeing that the average cost of debt will remain stable even in volatile scenarios. In the same direction, the plan confirms the Group’s intention to meet its financial requirements through fixed-rate bond issues, including green and/or sustainable bonds, in order to respond with additionally increased efficiency to the Group’s investment needs and thus guarantee the implementation of innovative and sustainable projects in the waste management, water and energy sectors. Coherently with the above, in October 2021 Hera launched its first sustainability-linked bond, worth 500 million euro, as part of its funding strategy, representing once again Hera’s commitment to achieving the objectives on the UN 2030 Agenda. This sustainability-linked bond is tied to actions included in the business plan relating to projects to reduce greenhouse gas emissions and increase the amount of recycled plastic. It attracted great interest from international investors, who subscribed for roughly four times the amount offered. This new bond creates value both from an operating-financial point of view, by reducing financial charges and extending debt maturities, and as regards image, because it sends a concrete signal of environmental commitment to the market, linking the return of the bond to the achievement of objectives.
Most of the Group’s business is concentrated in Italy, and its rating is thus closely linked to the country’s rating, its macroeconomic trends and its political scenario. Hera’s actions and strategies remain oriented towards maintaining and improving adequate ratings; its usual communication with the rating agencies Moody’s and Standard & Poor’s (S&P) has confirmed positive feedback in terms of the solidity and excellent balance of its business portfolio, as well as in terms of excellent operating performance, efficient and proactive risk management and resilient creditworthiness indicators. In 2021 in particular, Moody’s rating was confirmed at BAA2 with a stable outlook, while the S&P Rating Agency further improved its rating to BBB+ with a stable outlook. These recognitions reflect the path of growth implemented over the years and the results achieved by the Group in 2020, higher than expected. The rating obtained by the Group is among the highest in the multi-utility sector across Europe and higher than the sovereign rating.
Over the period covered by the plan, the ongoing adoption of sustainable financial reporting best practices will support the Group’s green financing and ratings. Hera has already been committed to green funding for some time: it was the first Italian company to issue a green bond in 2014, which was followed by an ESG-linked loan in 2018. In 2019, it adopted a Green Financing Framework (GFF), accompanied by a further green bond issue. An expected further improvement in sustainability ratings, in turn, will make it even easier to access lines dedicated to sustainable financing, characterised by potentially lower costs than traditional credit lines. Consistently with these guidelines, the Group is implementing the recommendations of the Task Force on Climate-Related Financial Disclosures (TCFD) of the Financial Stability Board, which foresee the definition of climate scenarios, risks and opportunities related to climate change, as well as processes for managing these risks, and the definition of targets for reducing climate-changing emissions.
In this context, becoming part of the Dow Jones Sustainability Index (DJSI), the first index to track the financial performance of the world’s leading companies in terms of sustainability, bears witness to the validity and credibility of the path taken by the Hera Group, opening up further developments. Recognitions of this type, in fact, act above all as a stimulus and allow Hera to identify the areas to be developed for further improvement in its performance and, at the same time, to include among its reference investors those who are engaged in socially responsible investing (SRI), a segment that, as mentioned above, is undergoing considerable and continuous expansion.
Business areas and industrial strategy
In January 2022, the Group’s new 2021-2025 business plan was presented. It defines a strategy covering the next few years which is capable of driving economic and industrial growth and focuses on sustainability, in line with European and national policies and the objectives on the UN 2030 Agenda. The framework adopted confirms the Group’s previous strategic approach, while placing even greater emphasis on its implementation. All the projects underlying the business plan have been defined in detail in order to progress in three areas, namely:
As regards free-market businesses, the Group’s strategy focuses in particular on the areas of industrial and commercial development, in terms of decarbonisation and contribution to the circular economy.
In the free-market businesses of the energy sector, the Group aims to consolidate its position at national level by expanding its customer base, to reach a target of 4.5 million energy customers by 2025. Consistent with the transitional climate scenario, that includes an increasing electrification of consumption, the Group has set itself the objective of increasing its customer base, especially in the electricity segment, with a growth of over 1 million customers, while keeping it substantially stable in the gas segment. Based on the plans made, in 2025 the customer base for electricity will exceed the customer base for gas. This goal will be pursued through growth in sales on the one hand, and the opportunities deriving from the liberalisation of the protected electricity market on the other, for which the Group expects to be awarded a portion of customers consistent with its market share. With reference to commercial growth, Heracomm will expand its range of Added value services (VAS) over the next few years, strengthening its solutions for reducing waste and proposals for protecting the environment and saving on consumption, such as photovoltaic generation and electric mobility, and thus achieving important commercial synergies. In order to strengthen communication between the supplier and the customer and encourage the latter to engage in sustainable behaviour, customer experience-oriented initiatives will be implemented, focusing on economic aspects and digital evolution, through dedicated green loyalty programmes. In the coming years, Hera will also continue to address the energy transition of its customers by exploiting the opportunities offered by the super-bonus for condominiums, the effectiveness of which was recently extended to 2025, while modifying the rates and the parties concerned. Finally, the Group’s interest in participating in tenders in markets of last resort is confirmed, with the aim of reconfirming its position as a key player on the national scene.
With regard to the waste treatment and recovery business, the Hera Group intends to consolidate its leadership by leveraging plant and industrial development with a view to the circular economy, as well as on commercial development in the industrial waste and recovery sectors. In the latter area, Hera will extend the capacity of plants dedicated to treating flexible plastics (PET and LDPE), and will enhance the partnerships initiated with important operators in the sector, entering the rigid plastics segment by constructing an innovative plant for the production of high-quality recycled polymers. Concerning sustainable industrial development, the Group also plans to build two new biomethane production plants, replicating the success of the Sant’Agata Bolognese plant, in order to double biomethane production by 2025 compared to current levels. In terms of commercial development, the Global Waste Management solutions offered to industrial customers will be strengthened, with customised services covering the entire waste cycle, water resource management and energy services, fully exploiting the synergies between the various businesses covered by the Group. The ongoing commitment to achieving sustainability targets is further confirmed by the objective of reducing the use of landfills for municipal waste to below 3%. This will prospectively mitigate the physical risks of this supply chain related to climate change. For more details, see paragraph 1.02 “Risk factors: actors, methodology and areas of management”.
With regard to regulated businesses, the lines of development pursued over the next few years will focus on strengthening adaptive and reactive resilience to climate change and the asset readiness of infrastructures, in terms of modernisation, digital evolution, redundancy and preparation for the distribution of green gas, and on reconfirming Hera as the reference operator in gas distribution and urban environmental services in the areas currently covered, which are expected to be put to tender during the time covered by the plan.
In gas and electricity distribution, in order to prevent and mitigate exogenous risks and in favour of overall strengthening and greater digitalisation of infrastructures, increased resources have been allocated compared to previous planning. The most important projects in the plan include a project for the installation of increasingly advanced meters, which, in addition to allowing more precise measurement of consumption, will offer sales companies the opportunity to exploit the numerous kinds of information relating to users. In the area of gas distribution, 300 thousand NexMeters are to be installed. These smart meters, developed by Hera with Panasonic, provide benefits in terms of operational safety and environmental protection, thanks to the reduction of gas dispersed into the atmosphere. A green version has already been developed for measuring green gases, in particular a mixture of methane and hydrogen, and its components are made from a significant percentage of recycled plastic. With regard to electricity distribution, the old meters installed in all areas managed by the Group are expected to be replaced with new generation (2G) devices.
The business plan also foresees the start-up of a Power-to-gas plant, built at the Idar purification plant in Bologna Corticella, which will make it possible to exploit synergies in the various businesses managed by the Group (not only gas and electricity, but also the water cycle), and at the same time to start experimenting with the production and distribution of hydrogen or other green gases.
In the water cycle, work will continue to make networks more resilient to climate change, smarter in terms of automation and remote monitoring of assets, and more efficient in managing water resources. Pursuing these objectives, Apennine sources will be upgraded, predictive models will be implemented that can anticipate supplies in the event of prolonged drought risk, and predictive maintenance will be enhanced with a view to a selective renewal of the network. The Group’s attention also continues in the purification phase, benefitting the circular economy, which has always been an important objective for the Group and will be further pursued in the period covered by the plan. The extension of the programmes for reuse of water resources in agriculture to the other plants in the areas managed will allow the current volume of wastewater sent for reuse to be increased, reaching 8.5% of the total reusable water by 2025.
District heating will also receive incremental investments compared to the previous plan, benefiting business continuity and the smart evolution of the infrastructure. The project for the physical interconnection of two district heating systems in Bologna will be the most significant initiative in this business over the next five years and will make it possible to optimise plant capacity while providing important benefits in terms of reducing CO2 emissions.
Lastly, in the urban waste management business, the Group has confirmed its commitment to achieving recycling targets, focusing on improving the quality of sorted waste collection. To this end, new communication campaigns and citizen engagement actions will be launched, with a particular focus on single-use plastics and packaging, as well as the fight against abandonment and degradation. To support the virtuous behaviour of citizens, 62,000 Smarty (with IT devices) bins will be made available, covering more than half of the current amount, which can be monitored remotely and in real time (by a control room) in order to improve the service and optimise operators’ interventions.
The path of growth outlined in the strategy described above will allow the Group to reach 1,400 million euro in Ebitda by 2025, up 277 million euro compared to 2020, thanks to the contribution of both internal and external growth. Investments coming to more than 3.8 billion euro, allocated in the period covered by the plan, will provide the basis for changes in margins and the implementation of the projects foreseen over the next few years, which will be significantly higher than both the average of the last five years (+59%) and the amount set out in the previous plan (+20%). Of these investments, around 1.2 billion will be earmarked for plant resilience, with a view to adapting to identified climate risks, such as strengthening the electricity distribution network and developing interconnections of water and gas networks. Despite this significant financial commitment, the net debt/Ebitda ratio will remain constantly below 3x, thanks to a sustained cash flow and the optimisation of financial and fiscal management.
The Group has also confirmed, in this industrial plan, the consistency of its strategy with the most recent and ambitious European policies, as well as with the recommendations of the UN Agenda. By 2025, 55% of the Group’s total Ebitda will contribute to creating shared value, driven by approximately 2.5 billion euros of investments over the period covered by the plan (66% of total investments). As of this year, a target of 70% of total Ebitda has also been set for 2030, in line with the growth trend recorded over the years.
Hera’s work towards the 2030 industrial targets set and communicated to the market a year ago also continues. The 2025 plan confirms, in fact, the converging path towards 2030 targets on carbon neutrality, the circular economy and shared value.
Hera’s strategy has always been based on a close relationship with the areas served and its own ecosystem. The evolution of this context, in its economic, political, local and technological aspects, affects the Group’s activities across the board and influences the guidelines that will characterize their evolution, leading towards increased resilience and accelerating the evolution of its corporate culture. “Growth”, in particular, offers an overview of the Group’s strategy, and is subdivided into various areas of action:
See the following paragraphs for further details about the strategic actions mentioned above, and the attention towards human capital implied by each of them.
Climate and the environment: sustainable development
Hera’s shared value framework, introduced in 2016, has oriented the Group’s strategy towards growth based on responses to the problems of the external context, capable of maximising shared value, both for the company and for the community. Creating shared value is the perspective that integrates an orientation towards sustainability into the very heart of the Group’s strategic approach.
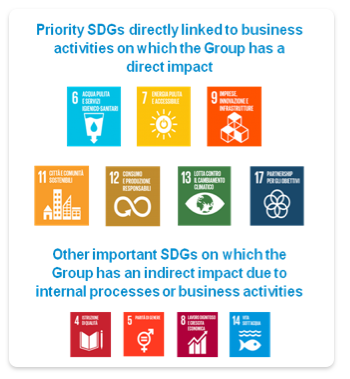
The 2020 revision of this model includes the topics of resilience and adaptation to climate change, drinking water (included within the scope of sustainable management of water resources, together with purification, which was already present) and biodiversity. These are issues to which the Group has been committed for years, which complement the other dimensions of Hera’s framework (such as the circular economy and sustainable management of water resources). The Group’s objective is to create shared value through business activities that are strongly integrated into the socio-economic fabric of the communities served, generate operating margins and respond to the drivers of the Global Agenda, i.e. the calls to action for change indicated by policies at a global, European, national and local level. The year 2021 confirmed the validity of the initiatives already launched by the UN Global Agenda 2030 to respond to the megatrends in place: fragile planet, technological disruption and accelerated urbanisation were considered the most closely linked to Hera’s business, having a direct impact on corporate activities. Hera’s contribution is most significant for seven sustainable development goals on the 2030 Agenda: 6) clean water and sanitation, 7) clean and affordable energy, 9) business, innovation and infrastructure, 11) sustainable cities and communities, 12) responsible consumption and production, 13) combating climate change and 17) partnership for the goals.
The Group’s website (https://eng.gruppohera.it/group_eng/sustainability) and its Sustainability Report (Sustainable Strategy and Shared Value section) offer further details on the actions that the Group intends to promote by contributing in a broad sense to the 169 targets or the 17 Goals of the UN 2030 Agenda. Also note that the Group has set itself clear industrial objectives for both 2025 and 2030, to make a significant contribution to achieving carbon neutrality. The main elements include energy efficiency solutions applied both within the Group’s operations and to customers (by valorising multi-business assets), the development of new renewable plants, the sale of green energy to customers and a strong commitment to reduce carbon dioxide emissions from the industrial chain, reaching 37% by 2030 (compared to 2019), calculated according to Science Based Target references.
In order to foster a culture linked to these SDGs among the Group’s entire workforce, dedicated training events have been made available on its corporate training platform, concerning the circular economy in particular; the UN agenda is also part of training for all newly hired employees. The main actions include those aimed at promoting energy efficiency, sustainable management of water resources, the selection of suppliers with qualifications in terms of environmental and social sustainability aspects, the development of employment and new skills, and the spread of innovation and digitalisation. In order to ensure that the principles of the Green Deal, operationally set out in the circular economy action plan and in Next Generation EU, increasingly become elements of which all Group employees are aware, specific training courses have been planned, which provide for the enhancement of internal skills to develop projects consistent with the SDG framework. Awareness of the significance of climate change is considered by the Group to be the first necessary step towards incorporating precise responses to the resulting risks and opportunities into its corporate strategy, consequently reflecting the effects of these responses in the drafting its multi-year plans.
Among the initiatives identified to seize the opportunities defined through an analysis of the climate scenarios hypothesised, the most promising were included in the Business Plan to 2025, which also reflects the mitigation actions identified in response to the risks defined. In particular, the Group’s strategy to implement climate change mitigation mainly consists of:
The Group’s approach to the circular economy also defines specific projects in the various sectors.
By way of example, the design and execution phases of engineering works show a progressive focus on the issues of sustainability, reducing the environmental footprint and minimising the use of virgin soil. Building information modelling (BIM) technology, which makes material analysis possible (even during plant demolition), allows for maximum recycling and reuse and extends the circular approach to the end-of-life of the work. The development of plastic recycling and an increase in the production of biomethane, foreseen in the period covered by the Plan, are increasingly oriented towards giving new value to the organic portion of solid municipal waste. The rationale underlying circularity also involves the Group’s main purchasing processes: Hera’s strategic approach involves an increasing focus on materials or goods that meet the principles of the circular economy and extends the adoption of minimum environmental criteria (MC) to the definition of product characteristics, not only to components for water connections but also to other standard elements of the networks such as gas and water reducers and sewer lifts.
The Group confirms its commitment to widely adopting circular economy solutions with medium- and long-term industrial objectives and projects based on defined deadlines, through technological and behavioural solutions to improve the volume and quality of sorted waste collection, new plant capacity for the treatment, recovery and recycling of special urban waste (including through partnerships in the local area) and, lastly, technology to maximise the reuse of water resources and advanced plant engineering for the quality of purification. Measures to increase the resilience of the Group’s activities also include the installation of remote-controlled accessories and sensors in all networks (to ensure remote monitoring and management), the installation of smart meters in each business, and the implementation of programming and modelling tools based on artificial intelligence, to anticipate critical events and optimise maintenance. Over the period covered by the Plan, for example, revamping and automation of primary electricity substations are planned, as is roboticising approximately 1,400 secondary substations (“Apennine resilience plan”, which will address resilience with a view to mitigating the risks identified in the electricity distribution sector). For further details, see the following paragraph, “Technology and human capital: innovation”).
To benefit the wider use of circular models, greater attention will also be paid to the various customer engagement tools, so as to use the different communication/dissemination channels according to the features of the various geographical areas, as well as to improve and expand the tools already in place by paying attention to the different types of customers.
The campaign to raise awareness of environmental challenges will continue to involve schoolchildren (environmental education projects), including distance learning designed for the current health situation, and will be carried out through the main media at a local level (press tour on environmental issues).
In order to support the energy transition towards which the entire company is called to act, the Hera Group constantly plans actions aimed at increasing energy efficiency among its various categories of users, as well as at exploiting every possible form of renewable energy.
Actions to reduce energy consumption within the Group's scope of operations (-8% by 2025 compared to 2013), as well as those carried out with industrial customers, household customers and public administrations, will therefore continue with even greater impetus. The legislative framework, while continuing to present interesting opportunities in the household sector, will facilitate the building renovations deemed necessary for a fully effective energy transition. Similarly, the real estate assets of the public administration will also have to see a gradual improvement in energy consumption.
The Group’s plant assets also have further potential to seize opportunities related to the development of new renewable energy vectors, such as hydrogen. The Group intends to become involved in the various phases of the hydrogen chain, and is launching experimental projects in this direction. In the sustainable hydrogen production phase, a circular solution comes from synergies between the electrolytic process and the water purification process, with multiple circular flows of material between the two activities (oxygen as input for purification and biogas from sewage sludge as material for hydrogen methanation). Or again, the Group’s Waste-to-Energy plants will be able to use biogenic electricity (considered renewable) to power electrolysers capable of obtaining hydrogen for industrial customers, mobility or the distribution network. With reference to gas distribution, experiments are underway on the Group’s assets to assess the optimal blending percentage between methane and hydrogen for the operation of cogeneration assets and plants for industrial and household users. Finally, note the project to install the latest generation of “NexMeter” gas meters, suitable for measuring hydrogen/methane mixtures, as described in the paragraphs above.
For Hera, the need to guarantee the quality and continuity of essential services in such a changing context, subject to increased climate risks, represents a cost, but at the same time an opportunity. The necessary increase in investments to improve the resilience of its assets puts the Group, thanks to its solidity and financial capacity, in an advantageous position compared to smaller competitors, who could face greater difficulties in dealing with such a volume of investments.
In other words, the Group aims to make the most of the opportunities offered by technological evolution and digitalisation to extract innovations, operational improvements, cost efficiencies and synergies related to data management, in order to meet the needs of the local area and stakeholders, to take a leading role in the provision of services and to accompany cities towards new development models, overseeing each technological upgrade by analysing its impacts and mitigating its side effects.
Technology and human capital: innovation
Advances in the chemical and engineering industries are at the forefront of technological development, and concern the waste management (first and foremost plastics) and energy (biogas and biofuels) sectors. This is where the search for concrete solutions may prove to be instrumental adapting to climate change or countering the depletion of natural resources. The Group strategically exploits these advances in order to identify plastic recycling processes that can flank mechanical procedures and make the process effective even for less pure and less valuable types of plastic. The same advances make it possible, for example, to experiment with solutions that use excess renewable electricity (otherwise unusable) to split molecules into hydrogen and oxygen and then convert the result into synthetic methane gas by adding carbon (from CO2).
Hera has adopted a Group strategy to exploit all available information and to be able to guarantee quality and exchange in data flows. The principles that have guided the implementation of this strategy come from an organisational approach to data architecture, which consists of four guiding principles:
The Group’s data strategy model and related guidelines were included in training courses intended for individual company units, with the aim of spreading awareness of the strategic plan at all levels. In order to increase the ability to block anomalous events, the data sources used with the convergence between the management environment (applications) and the industrial environment (Group plants) must be continuously extended. Vulnerability assessment activities in both environments, aimed at preventing attacks on systems and plants, are fundamental; to this end, the model calls for distributed actions and responsibilities, and will be further strengthened over the time covered by the Plan thanks to projects aimed at increasing monitoring capacity and the evolution of prevention tools.
The utility sector is fragmentary and shows considerable technological gaps, and this must be resolved in order to comply with new European directives. In order to consolidate its role in the Italian utility sector, Hera intends to leverage the specialisations it has built up over time, by implementing new analytical methods and developing projects to automate and digitise processes. More specifically, the Plan provides for various interventions, including: the implementation of additional types of parameterised estimates to be sent to customers following the insertion of a request in the front-office channels; the creation of a technical help desk that filters requests for estimates before inspections and assists customers, with the aim of reducing the number of technicians in the field, potentially including virtual inspections or online estimates. The next few years will also see the expansion in remote control, which will manage a considerably larger perimeter of activities, offering a significant operational capacity. Digital transformation processes will cover various business areas, in order to make the most of the opportunities offered by new technologies. In the sales business (energy and gas), for example, customer acquisition activities will be supported by advanced digital marketing tools; the technological infrastructures of the billing processes will be renewed to optimise the “meter to cash” process; electricity offers will be provided with customisable discounts thanks to the functions of new generation (2G) meters and, to enhance customer centricity, a new customer relationship management platform will be implemented. In distribution (water, gas and electricity networks) and collection (waste) businesses, the implementation of advanced functionalities aimed at improving the effectiveness of the service is planned, such as predictive maintenance, the sharing of operational progress with municipalities through the development of a “dual system” or the implementation of virtual control for containers, in order to optimise their maintenance.
Data strategy is increasingly designed in such a way as to transform the Group into a data-driven company, where decisions guided by data, valued as a corporate asset and subject to an ethical and conscious reading, highlight the growing importance of data management and resources dedicated to its protection.
In 2021, the cybersecurity initiatives carried out in the Group consistently concerned three main macro-groups: technologies, processes and people. Cybersecurity interventions were introduced both in the traditional spheres of ICT and ICS (Industrial Control Systems), and, more generally, cybersecurity in industrial plants (Operation Technology). In addition to what is required by national regulations in the field of Operation Technology, the Hera Group has adopted a security management paradigm that extends its perimeter to all potentially vulnerable systems, not limiting itself to the traditional field of management and network application infrastructures, but extending to the industrial plants through which the Group’s services are provided. In this sense, a convergence between cyber security monitoring in the IT and OT contexts was launched, which, in addition to introducing new network traffic monitoring probes in the management context, allowed an initial probe to be activated for analysing anomalies in industrial protocols dedicated to the OT context. The Threat Intelligence service also continued, consolidating relations with Italy’s Computer Security Incident Response Team (CSIRT) and the main public and private bodies. The Group also extended its vulnerability assessment activities, which previously covered IT, to OT as well, analysing some of the main plants at the basis of the Group’s service provision.
In order to increase its ability to react to cyber security events and integrate centralised, across-the-board monitoring capabilities in its IT and OT contexts, the Group extended its vulnerability assessment activities to the OT context. In order to limit cyber incidents and protect accesses, but at the same time guarantee the minimum possible impact in terms of user experience (especially as regards balancing swift access to resources and adequacy of security requirements), digital identity protection continued thanks to an extension of multi-factor authentication. The widespread introduction of cybersecurity awareness continued through a dedicated online training platform, which now covers the entire corporate population, and monthly adaptive ethical phishing exercises.
These activities, on which Hera’s strategic model focuses, contribute to a reduction of overall risk, as well as to the Group’s preparedness for possible attacks, which translates into greater speed of action and reaction.
The evolution of technology and digitalisation, calling for continuous development of employee skills and the consequent training needs, confirms the Group’s strategic decision to introduce cloud-based platforms to increase individual productivity and as the main tools for collaboration, since cooperation between man and technology requires continuous evolution in the way we work. With this in mind, process automation projects (virtual factories and digital labs) encourage a wider awareness of technological integration, focusing on initiatives to apply artificial intelligence and enhance the community, through digital workplace tools.
The Group intends to use data to generate value for people and for its business; the gradual digitalisation of human resources management processes, as well as the creation of a reference architecture to integrate systems and data available by using a prescriptive analytics approach, confirm this intention. Lastly, the Group’s strategic vision of digitalisation technologies, which logically overlap with the area of environmental and social sustainability, led to the introduction in 2020 of a strategic framework called Corporate Digital Responsibility (CDR), which is described in detail in the Sustainability Report.
In the context marked by the transitions currently taking place, human resources development guidelines are constantly updated in order to address priorities within the Next GeneHERAtion Growth model and guide the company’s policies. In order to bring out ethical values and behaviour that represents a distinctive model for the Group, a culture oriented towards results, relationships between individuals and widespread leadership is increasingly encouraged. The Group’s programmes on culture and an agile approach to improve performance, achieved by embedding trust, responsibility, autonomy and work ethics, are guided by the continuous development of a “work by objectives” culture. As part of the Group’s strategy, it is fundamental to make everyone feel that their work and sense of belonging are related to the company’s overall results and performance. In order to go beyond the concept of equality and achieve fundamental fairness in treatment, thus recognising specific individual features, as of 2021 the Group has launched a project for the evolution of performance management, with the aim of making the dialogue between team leaders and team members increasingly effective, orienting it towards accountability towards measurable objectives and greater delegation and autonomy in the organisation of work activities. This Result management-oriented path will be further consolidated through a series of initiatives foreseen over the time covered by the Plan. The Group, in this regard as well, continues its path of progressive digitalisation, which makes it possible to enable experiences, training, development and career paths in an increasingly self-determined manner, confirming the rationale of individual and collective responsibility guided by purpose. Human resources management and development processes are designed to preserve the distinctive skills and values built up over time and, at the same time, to develop individual talent, regardless of gender and age, seeking innovation in all aspects that can generate added and sustainable value over time. Hera’s strategy hinges on the continuous development of an inclusive culture of diversity, understood as a means of generating change, in which employees can benefit from a good balance between the development actions assigned to them by the manager and the development actions in which the initiative instead comes from the individual. It is no coincidence that, in addition to retaining the figure of the Diversity Manager (introduced in 2011), Hera, a signatory of the “Utilitalia Pact - Diversity makes the difference”, promotes inclusive policies at all levels of its organisation, progressively refines measures to reconcile work-life balance and adopts a merit management system which is not only transparent, but also and above all neutral with respect to gender, age and cultural differences, with the adoption of systems aimed at monitoring progress and internal and external awareness-raising policies. Artificial intelligence and digital tools, moreover, are now consolidated in analysing the data emerging from listening initiatives, which allow for a deeper level of employee satisfaction on issues related to the working environment and corporate values, which translates into corrective actions in each employee’s department, but also through internal mobility involving more than one department. In order to verify the level of satisfaction and engagement of the company population, in 2021 a further accurate and quantitative analysis of the gender pay gap was launched within the company, investigating diversity in relation to the roles played, the performance achieved and seniority in the company.
The Group’s strategy also contributes to creating value by accelerating the processes of re-designing training activities with a blended learning approach, continuously evolving its professional academy courses, encouraging an increasingly widespread use of the HerAcademy learning centre as a reference point for knowledge sharing within and outside the Group, not to mention other projects to further improve employee engagement. As of 2022, the ambassador engagement project will be finalised, with the aim of developing engagement through digital channels, inside and outside the company.
Consistently with its corporate direction, the Group has planned multidisciplinary initiatives to develop projects coherent with its SDG framework, with particular reference to the circular economy, and to work with an ecosystem outlook alongside the Group’s various stakeholders, to converge towards common objectives in terms of the green economy. The wider presence of a green culture and an approach oriented towards sustainability and circularity is a central element of Hera’s strategic plan, and presupposes a process of cultural change that, since last year, has been supported by various initiatives. The intervention concerning digital skills, customised for the entire company population, is continuing, to accompany the energy and environmental transition with updates in roles, skills and the Group’s training offer. The objective of achieving results in terms of green economy related a reduction of the Group’s carbon footprint, by way of example, is shared through an enhancement of the contribution of remote working, or through a reinforced green offer as part of corporate welfare tools, or again through raising awareness of green issues even at the time of recruitment. From 2022, the propensity to adopt an approach that is culturally consistent with these principles will become a key element in the Group’s selection, recruitment and development processes.
An integrated vision of technological evolution and employee experience, accompanied by the application of Organisational Network Analysis, artificial intelligence and business intelligence tools, aims to foster the optimisation of organisational processes, human capital development and individual decision-making capabilities. The evolution of skills and roles according to business needs, through a strategic dialogue between the lines of business and human resources, allows the meaning of the business challenges addressed over the time covered by the Plan to be shared, along with a sense of the risks and opportunities involved.
After identifying the factors of success for the utilities of the future, and the objectives of industrial growth, circularity and risks are translated into an equal number of coherent company policies.
Risk governance
The Hera Group’s organizational structure is designed to manage any risk exposure arising from its businesses and simultaneously to uphold management effectiveness and profitability across the entire value chain.
Hera’s corporate governance system enables organisational strategies to be handled uniformly and consistently. The Risks Committee is the principal policy-making, monitoring and reporting organ for risk management. Additionally, under article seven of the Self-Governance Code, the Controls and Risks Committee oversees the internal auditing system, the efficiency of corporate operations, the reliability of financial reporting and compliance with laws and regulations, as well as the protection of company assets. In order to maximise the consistency of the management strategy, these bodies meet periodically. During 2021, the Risks Committee met four times and the Controls and Risks Committee met seven times.
The Group has adopted a three-tier risk defence strategy, appropriately distinguishing:
The Risks Committee sets the general risk management guidelines, maps and monitors corporate risks, ensures that risk policies are set forth and outlines the information protocols targeted to the Controls and Risks Committee, the Internal Auditing management and the Statutory Auditors.
The Board of Directors approves the risk policies and measurement parameters, guides and assesses the adequacy of the internal control and risk management system. The Controls and Risks Committee supports the Board of Directors in defining internal control and risk management guidelines.
The President and the CEO supervise, each within their area of responsibility, the internal control and risk management functions. The Vice Chairman oversees coordination between the Risks Committee and the Controls and Risks Committee, maintaining their own independent status.
The risk governance structure is outlined here below:
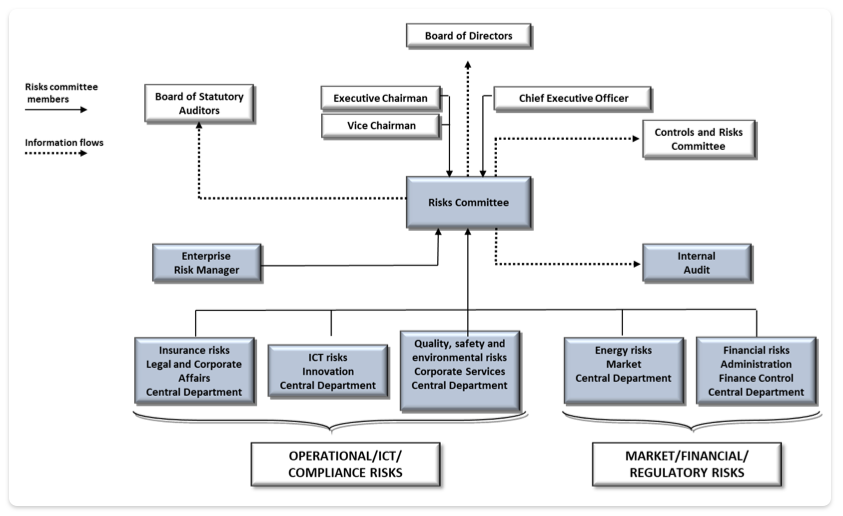
Management methodology
Hera has introduced the Enterprise Risk Management (ERM) process, to provide the Board of Directors with useful elements for assessing the nature of corporate risks and defining the Group’s risk profile, particularly in the medium to long term. The definition of the risk profile is made explicit by the Board of Directors itself through the approval of the Group risk management policy and the risk limits established therein.
The risk management framework is formulated through three key elements:
On 27 January 2022, the sixth Enterprise Risk Management report on the 2022-2025 business plan was presented to the Board of Directors.
Over the course of 2021, the ERM analysis made further methodological improvements and refinements:
The 2021 ERM analysis did not reveal any critical risks, either in terms of reputation or operating-financial impact.
Areas of significant risk include reputational impact deriving from possible proceedings by supervisory/regulator/investigation bodies, generated by the degrees of discretion on the opening of audit/investigation procedures in cases of non-univocal interpretative guidelines (even when the Hera Group’s conduct complied with legal provisions), as well as the operating-financial impact deriving from high-intensity seismic events relating to networks. The risk deriving from potential fires at waste treatment and recovery plants is confirmed; however, the related impact in terms of consequences on Group results is assessed as insignificant, while consequences for the environment and operational continuity have zero impact. However, due to growing social awareness on the issue, such events may lead to significant reputational consequences because of perceived risk. The difficult economic situation, which is due to the long-term effects of the health emergency, spreading in various ways across the agenda and priorities of all economic operators, could also affect the full compliance of the actions undertaken by companies which, on behalf of Hera, work through external contracts on the networks managed by the Group. However, Hera is committed to containing this risk by confirming its commitment to extensively monitoring the health of the value chains involved in its business.
Risk areas: identifying and managing risk factors
The existing and emerging risks which Hera faces belong to different types: risks deriving from the evolution of the macroeconomic and financial, business (regulatory and competitive), technological, environmental and human capital contexts, including with constantly increasing regard to climate change and sustainable development. Paragraph 1.01, “Contexts and trends, strategic approach and Group management policies”, provides a detailed analysis of the factors constituting some of the fundamental prerequisites for identifying these risks.
In order to mitigate exposure to these risks, introduce optimisation measures (including technological and efficiency improvements) within current structures and develop strategic planning that offers coherent responses, Hera carries out the specific analysis, measurement, monitoring and management activities described below.
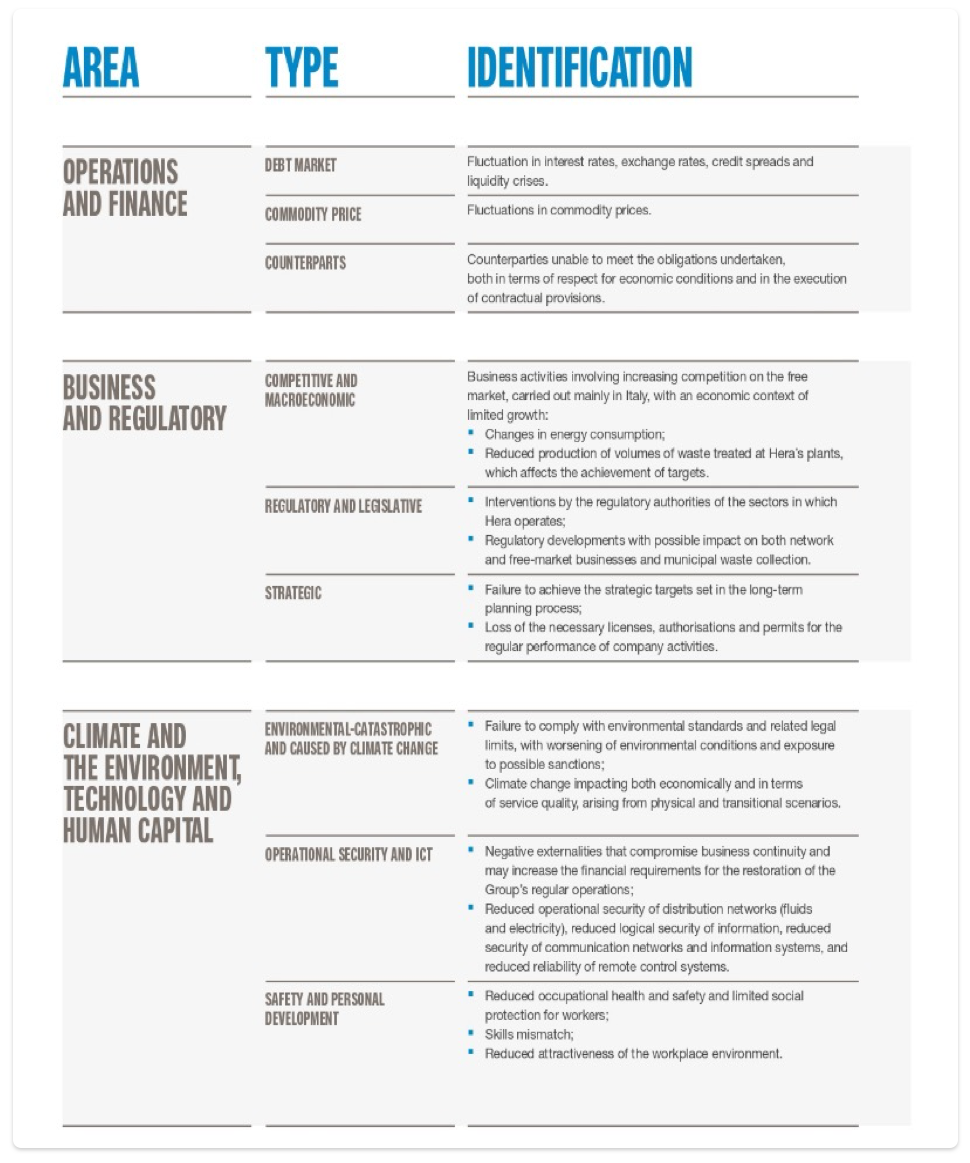
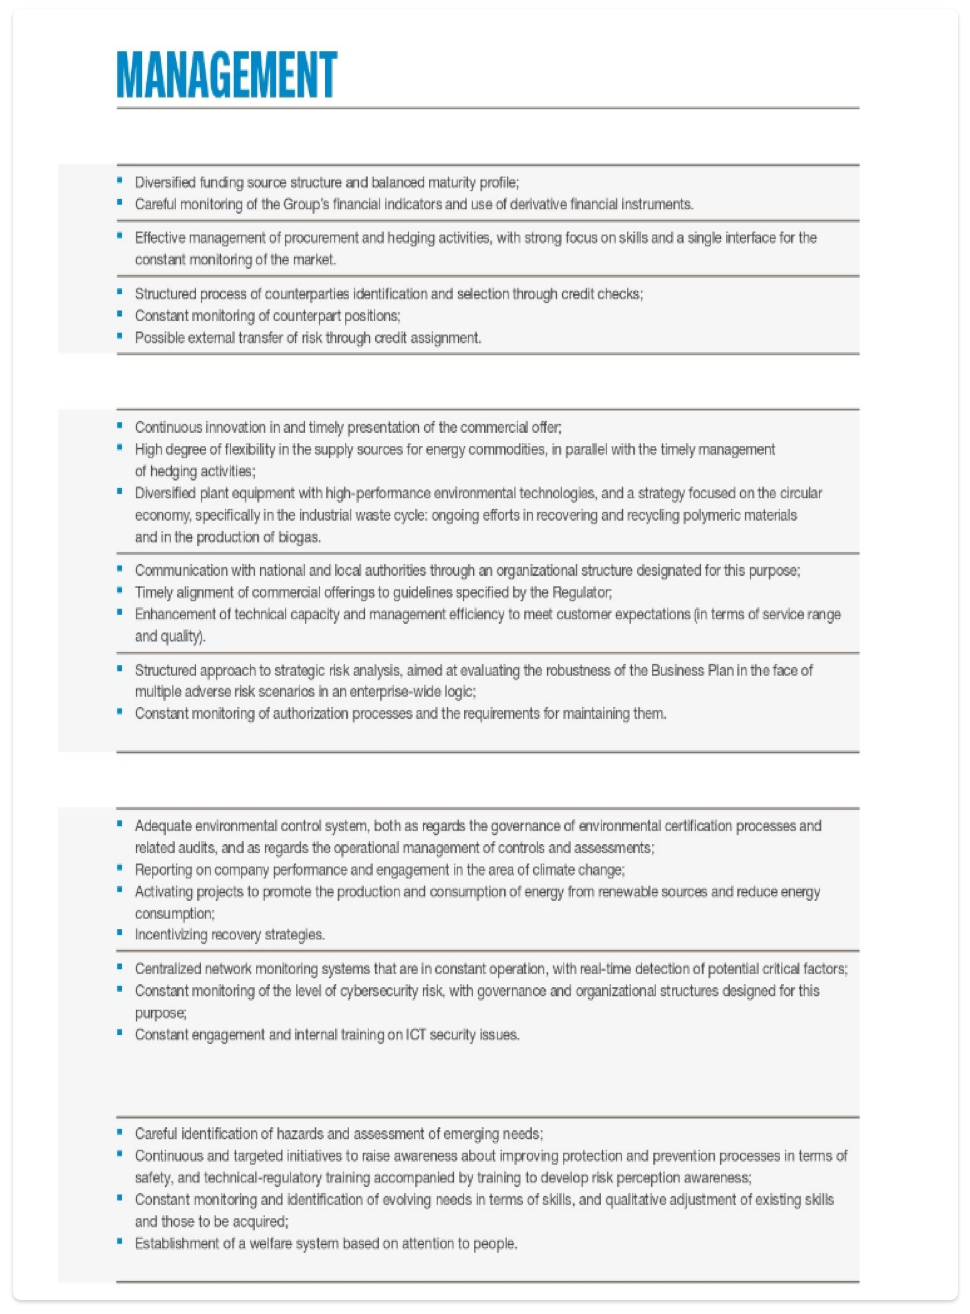
Operating and financial area
Identification of commodity price risk
The Group operates in an integrated manner in the supply and sale of electricity and gas at different stages of the value chain. Hera is therefore exposed to risks arising from the volatility of energy markets, which are only partially mitigated by an integrated assessment of these markets and associated management strategies.
Energy market risks are centralised in the Central Market Department, which is responsible for the purchase and sale of electricity and gas.
Managing commodity price risk
In order to standardise the approach to risk of the various corporate structures involved and with the aim of optimising the use of the market for hedging operations, the Group has adopted specific policies aimed at setting guidelines and operating procedures for the energy risk control and management process. Hera structured the processes to achieve effective management of procurement and hedging concerning the energy market, with a clear-cut focus on the skills involved. The Group’s approach provides for a single interface for the management of risk to market: Hera Trading. A unified risk management approach in compliance with the assigned policies provides advantages in terms of achieving higher levels of coverage, cost optimization by resorting less to the market, and greater flexibility in structuring procurement and supplying customers.
Identifying risks associated with the debt market
The operating and financial context, in addition to fluctuating energy and commodity prices, shows changes in interest rates, exchange rates, credit spreads and possible liquidity crises. Such fluctuations may affect Group results, future growth and strategic investments (e.g. due to high refinancing costs).
The Group might not be able to meet its payment obligations due to an inability to raise new funds or to do so only on unfavourable economic terms, or an inability to liquidate assets on the market or due to a changed risk perception on the part of the market. Among the factors determining this perceived risk, the creditworthiness assigned to Hera by rating agencies plays a key role, as it influences the possibility of accessing funding sources and the related economic conditions. The Group’s debt structure is not subject to financial covenants on debt balances, with the exception of the corporate rating limit defined on a portion of debt equal to approximately 150 million euro (i.e. in the assignment of a rating lower than BBB-). On the other hand, with respect to the remaining outstanding debt, mandatory early repayment is provided for only in the event of a significant change of control over the Group, in the event that a concession is revoked (concession event), or assets are sold (sale of assets event), resulting in downgrading the Group to non-investment grade or lower, or terminating of the publication of the rating.
Managing risks associated with the debt market
Hera’s financial management is centralised in the Central Administration, Finance and Control Department, which aims to maintain an adequate balance between the maturities of assets and liabilities, matching investments to consistent sources of financing in terms of duration and repayment methods while taking into account the need to refinance the current debt structure. In order to meet its medium- and long-term commitments, Hera’s strategy involves diversified financing sources and a balanced maturity profile, constantly monitoring rating indicators and the availability of long-term credit lines. This strategy is considered effective in minimising liquidity risk even in the event of particularly critical scenarios. Approximately 66% of the Group’s financial debt is long-term (more than five years) and 86% of this is represented by bonds with repayment at maturity. See note 26 to the consolidated financial statements, “Non-current and current financial liabilities”, for further details in terms of worst case scenarios.
Moreover, the Group’s activities and strategies are particularly focused on ensuring that the highest rating level is maintained, as confirmed by the upgrade of its rating to BBB+ with a stable outlook by S&P, in May 2021.
Financial risk control and management processes are based on a careful monitoring of the Group’s financial indicators, as well as a permanent presence on the benchmark markets, to minimise the impact of interest rate and spread volatility so as to ensure efficient debt servicing. The Group also uses derivative financial instruments to reduce its exposure to interest and exchange rate fluctuations. At 31 December 2021, the Group’s exposure to the risk of interest rate fluctuations was 7%, while the remaining 93% of debt is at a fixed rate. A 1% increase in the benchmark interest rate with respect to the business plan scenario, based on the assumption of a coupon rate shift and the Group’s debt structure in the plan, would increase financial expenses by an average of approximately 7 million euro per year.
Identifying risks from counterparties
Hera operates with counterparties that might fail to fulfil their obligations, unable to comply with either economic terms or any contract provisions (delivery of goods or services). Additionally, credit risk affects the group across all of the various areas in which the company operates: the sale of energy commodities and services, waste treatment activities and telecommunication services.
Managing risks from counterparties
Hera employs a structured origination process, formalised in specific credit risk management procedures; this process allows the Group to adequately select its counterparties through credit checks and requests for guarantees, where applicable. In addition, its positions in relation to the counterparties are regularly monitored while articulated, proactive actions are planned, including external risk relocation through credit transfer, where appropriate. Expected losses are constantly estimated and monitored; the Group employs measures of default probability, exposure at default and loss given default developed on the basis of its own historical series, customer payment behaviour and current credit processes. In order to test the soundness of the models, both internal and external information is used that may serve as a benchmark for the evolution of the macroeconomic environment.
In 2021, the 24-month unpaid ratio of the Group’s main sales companies amounted to 0.85%.
Regulatory and business area
Identifying competition and economic risks
Hera operates mainly in Italy, where there has been a recovery in energy consumption and in the volume of waste disposed of in connection with the easing of restrictive measures following the emergency situation due to the pandemic. External factors, however, still influence this economic recovery; in addition to the pandemic, the sudden and abnormal increase in the prices of energy and other raw materials, as well as the difficulties connected to global logistics chains, all contribute to putting pressure on sales margins which, added to the increased competition on the free market, may impact the Group's profitability. Changes in retail energy consumption levels, and the increased difficulty in forecasting volumes to cover the needs of the sales portfolio, may require Hera to purchase or sell additional energy on unfavourable terms.
The potential reduction in waste production, deriving not only from the economic context and European and national regulatory frameworks but also from new trends in customer behaviour, together with the unavailability of treatment and recovery infrastructures, may have a negative impact on the Group’s ability to pursue its objectives. The risks of the waste management business related to the management of its set of plants are centralised under the Herambiente Group.
Managing competition and economic risks
The Group has maintained elevated flexibility in energy procurement sources while at the same time developing hedging activities to minimize exposure to operating risks from electric generation, thus ensuring ongoing alignment with the market and maximising natural hedging.
In waste management and treatment activities, the Group’s diversified plant equipment features technologies that are cutting-edge and high-performance in terms of environmental impact, which to date has enabled the Group to achieve its strategic objectives. The implementation of a circularity strategy – through the inclusion of polymeric materials in the recycling process carried out by Aliplast Spa – and the development of recycling lines for other types of plastics make it possible to seize the opportunities offered by the evolution of European legislation.
Over the years, free-market businesses have gained increasing importance in the Group’s portfolio, contributing significantly to its economic performance but also exposing it to growing competition. The Group responds to the challenge of competition by continuously innovating its commercial offering and introducing these new products in a timely manner, increasing its presence and customer base on the free market, and ensuring the fulfilment of expectations in terms of service range and quality.
Risk analyses deriving from changes in the economic context (GDP and inflation) and energy market conditions (gas and electricity prices) make it possible to quantify the sensitivity of the Group’s Ebitda to changes in primary operating and financial indicators.
In particular, a 1% reduction in GDP compared with the business plan scenario would lead to an average annual drop in Ebitda of approximately 3 million euro.
A 1% reduction in the inflation rate compared with the business plan scenario would lead to an average annual drop in Ebitda of approximately 5 million euro. The reduction of the electricity price in the wholesale market by 1 €/MWh compared with the business plan scenario would lead to an average annual drop in Ebitda of approximately 0.5 million euro.
Finally, the reduction of the gas price by 1 €c/smc compared with the business plan scenario would lead to an average annual drop in Ebitda of approximately 0.2 million euro.
Identifying regulatory risks
Hera carries out part of its activities in a regulated market, therefore its operations are influenced by the regulatory measures taken by the sector authorities and legislator (in particular concerning tariffs and market structure), government incentives for renewable energies, the concessions granted by local authorities (in the case of regulated activities relating to waste collection services, gas distribution, integrated water service and public lighting) and national authorities (in the case of electricity distribution), as well as by the impacts expected from changes in the market structure and its liberalisation, and from the evolution of supply and demand in the energy and waste management sectors.
Periodic updates of the legislative and regulatory framework, both at national and European levels, may significantly impact on the sectors in which Hera operates, influencing its profitability.
Regulatory risks impact network businesses (water, gas and electricity distribution) and the urban hygiene business and result in the introduction or modification of economic, organizational and IT requirements to be met by Hera, and on potential market structure changes caused by them.
The tenders for gas distribution, the integrated water service, waste collection and street sweeping scheduled in the Plan determine the risk of losing some of the areas currently managed, especially in contexts with a significant presence of competition. However, it should be noted that, in the event of a loss of management areas, the Group is compensated for the portion of invested capital not yet depreciated.
Lastly, there is a risk arising from the regulatory uncertainty surrounding the end of the protected services, in terms of the implementation timeframe.
Managing regulatory risks
The Group’s organisational structure liaises with national and local authorities and carries out extensive consultation with institutional stakeholders, actively taking part in working groups established by authorities and adopting a transparent, co-operative, proactive approach towards possible regulatory instability.
The Group operates by making the most of its technical skills and management efficiency. Indeed, Hera’s focus on service quality, cost efficiency and innovation is a competitive strength in tenders for gas distribution, the integrated water service and waste collection and street sweeping services.
Identifying strategic risks
Strategic risks associated with long-term planning, financial sustainability, the involvement in strategic initiatives and appropriate investment decisions affect the soundness of results for the various supply chains and business units. Moreover, the Group’s ability to achieve its strategic objectives may be compromised if the necessary licences, authorisations and permits to carry out its activities are not maintained or obtained.
Achievement of the planned results is therefore conditioned by the different endogenous and exogenous risks that are simulated, measured and controlled as appropriate.
Managing strategic risks
Hera has developed a well-planned strategic risk analysis model (ERM) designed to gauge the soundness of its Business plan against a variety of adverse risk scenarios, which supports an integrated risk projection from an enterprise-wide viewpoint. Thanks to this model, it is possible to perform scenario analysis, stress testing and what-if analysis of plan forecasts through an effective analysis of risk factors and related variables, and enables an adequate assessment of the risk level of the various business sectors.
Hera constantly monitors the authorisation processes and proactively participates in the working tables for obtaining permits, licences and authorisations, to avoid the possibility of jeopardising the regular performance of its activities.
Environmental-catastrophe, climatic, technological and human capital areas
Seismic, atmospheric and other climatic events may affect the resources deployed and consequently the Group’s performance. Hera seeks to enhance these resources by ensuring that they are preserved and developed so as to continue to enjoy their benefits in the future. In this context, the physical and transitional risks linked to climate change are particularly important, as are accidents in the Group’s plant equipment which in turn may generate potential environmental damage. In this respect, the Group has already developed a detailed analysis of the TCFD recommendations which led on one hand to implementing, at the operational and strategic level, best practices for managing risks and opportunities related to climate change, and on the other hand allowed the Group to gradually align its current reporting instruments with these recommendations. Risks arising from cybercrime, which Hera also assesses in terms of their impact on service continuity, are also becoming increasingly significant. It also becomes imperative to determine whether accidents may pose a risk to people’s rights and freedoms, i.e. whether they may cause physical, material or immaterial damage, based on the parameters and acceptability thresholds defined by Group policies (published on the company’s web portal).
The risk management approach is organised according to the specific areas in which environmental, technological and human capital risks occur.
Identifying environmental-catastrophe risks
Hera uses natural resources to provide essential services to customers. As its activities have an environmental, water and carbon footprint, the Group is aware of the need to preserve natural resources by adopting mitigation and adjustment measures to reduce these risks. In keeping with the ambitious goal to reduce current levels of greenhouse gas emissions as set out by international organisations, the following physical and transitional climate change risk scenarios have been identified as relevant to its activities. For further details, please refer to the next section “Identifying climate change risks”.
In terms of the environmental standards that Hera must comply with in carrying out its business, the Group’s activities are subject to various rules and regulations, including rules relating to CO2 emissions, emissions of other substances produced by combustion, water discharge and the handling of hazardous and solid waste. Non-compliance with CO2 limits contributes to environmental changes, while non-compliance with legal limits on other environmental aspects leads to worsened environmental conditions and exposes the Group to fines.
Scarcity of water resources, or possible contamination of water reserves, may affect the regular water supply and cause service interruptions or significant environmental, economic and social damage, worsening the water stress on natural resources in order to meet water demand.
In addition, there are risks stemming from the impact on the Group of weather variability in relation to the electricity and gas demand deriving from the various scenarios. The most significantly affected areas pertain to the Central Market Department, which is exposed in terms of electricity, gas and heat sales and to the variable demand resulting from different weather scenarios.
Managing environmental-catastrophe risks
Investments aimed at preventing and reducing the frequency of harmful events and measures to curb their severity, play a key role.
The Group’s commitment to reducing carbon dioxide production began with reporting on its own performance and commitments to climate change, and continues with projects to promote energy production from renewable sources, reduce energy consumption, and provide customers with opportunities to cut greenhouse gas emissions. The Group is committed to contributing to reducing environmental risks by complying with the energy efficiency objectives set by national legislation and the United Nations, continuing to improve its production facilities and encouraging virtuous and responsible forms of consumption on the part of its customers. The Group uses exclusively electricity from renewable sources to operate its production sites. In relation to the consequences of extreme events, which are expected to occur with increasing frequency as a possible consequence of climate change, Hera has taken steps to adopt important measures, such as, for example, the Rimini seawater safety plan, currently underway which, in addition to maintaining the quality of marine resources, increases the resilience of the stormwater drainage infrastructure in the event of extreme events. For further details on specific initiatives, please refer to the section “Mitigating climate change” in the Hera Group’s Sustainability Report.
Hera has adopted an environmental control system that is effective both in terms of the governance of environmental certification processes and related audits, and in terms of the operational management of controls and surveys. The Group succeeds in tackling environmental hazards by constantly monitoring potential pollution factors and ensuring transparency in surveys, as well as through substantial investments in technological plants that ensure consistently better air and water quality than required by legal limits. For more details, see the sections on “Protection of air, soil and biodiversity” and “Sustainable water management” in the Sustainability Report. Moreover, in line with its circular economy strategy, Hera has already invested (and continues to do so in the medium-to-long term) in sorting, recovery and composting plants, increasing the amount of waste treated while at the same time reducing the use of landfills, thus anticipating the requirements of European and national regulations. For more details, see the “Transition to a circular economy” section in the Sustainability Report.
The strengthening of the resilience of the Group’s water supply and distribution system in a medium to long-term outlook is ongoing. Furthermore, the reduction of the water footprint is pursued through the water management system, which aims to promote sustainable management of this resource both inside the Group (by preventing network leaks, reducing diffuse consumption, recovering rainwater for irrigating green areas and washing vehicles) and externally (by monitoring domestic consumption and offering advice and solutions to optimise it, providing support with technological solutions for water-demanding customers, and providing support for the construction of treatment plants to reuse/recover water). The implementation of water safety plans in the integrated water service also ensures an approach to water quality management based on risk assessment and management, and thus on prevention and control.
Regarding weather-variable risks, the Group relies on advanced demand forecasting tools that ensure an optimal use of the available sources. It also relies on adequate flexibility in the supply sources of energy commodities, ensuring their availability at market rates. A 1°C increase in the average winter temperature compared with the Business plan scenario leads to an average annual drop in Ebitda of approximately 13 million euro.
Identifying climate change risks
The physical and transition risks from climate change scenarios pertinent to the Group’s activities have been classified according to their potential consequences on business, and submitted to further impact and mitigation assessments in relation to their criticality (some examples include extreme weather phenomena such as floods and droughts as well as health and economic risks).
Climate scenario analysis is a methodology to test the resilience of business plans under different assumed future developments. Hera selected two of the most relevant scenarios out of the nine that were considered as starting points. In particular, the IEA ETP 2DS transition scenario by the International Energy Agency, chosen as an optimistic climate scenario, envisages a future evolution characterised by strong decarbonisation processes in order to keep the temperature increase below 2°C: this scenario has been used in identifying transition risks. The IPCC RCP 8.5 scenario, chosen as a pessimistic scenario, instead envisages a ‘business-as-usual’ trend and consequent sharp temperature rise (approximately 4°C): this scenario has been used in identifying physical risks. Based on these scenarios, 8 physical risks and 8 transition risks were identified, associated with related business impacts. Each risk and opportunity was associated with a timeline, a priority level (defined as the combination of the probability that the context in which Hera operates will change and the impact of the risk/opportunity on the business) and consequent management methods, in the case of the risks identified, and business initiatives, in the case of the opportunities identified.
| Type | Causes |
|---|---|
| Physical risks |
|
| Transition risks |
|
During 2021, a flood risk analysis was carried out, with a medium-long term time projection, to assess potential impacts on the Group’s assets deriving from extreme phenomena related to climate change. The conclusion of this analysis, and the ensuing updated scenarios, are expected within 2022.
Note that physical risks are distributed over both the medium and long term, with a higher number of occurrences in 2031-2050, consistent with the notion that climate change impacts will become more evident in the long term..
Transition risks are mainly concentrated in the medium term, and are distributed across all categories of the classification suggested by the TCFD. Each risk has also been associated with one or more management methods: 21 management methods were identified for physical risks and 12 for transition risks; some of the resulting actions have already been integrated into the investments made, as well as reflected in the Business plan. For more details, please refer to the section “Hera’s climate strategy” in the Sustainability Report. The investments and the mitigation and adaptation actions planned to date, moving in the direction of the energy transition towards carbon neutrality and the environmental transition towards the circular economy, as well as for technological evolution, in line with European strategies and the objectives of the UN 2030 Agenda, have been implemented within the estimated timeframe and at times accelerated in light of the Group’s positive results.
The short- and medium-term scenarios analysed by Hera Group may be updated on the basis of the consequences of the Russian military intervention in Ukraine. The uncertainties inherent in the future of this conflict may, in fact, not exclude an acceleration of the transition envisaged by the scenarios, or of the risks and opportunities emerging from the analyses. For an evaluation of the potential effects in terms of impairment tests, specifically in relation to gas consumption, see note 31 of the consolidated financial statements in paragraph 2.02.05 “Commentary notes to the financial statement formats”.
Managing climate change risks
Hera has launched a series of initiatives to mitigate the effects of climate change, and at the same time reduce its carbon footprint. Risk assessment activities continue, with the appropriate level of detail, especially with regard to transition risks and their modelling. The Group is developing an analytical framework with the objective of quantifying the individual impacts. Following the results of the first phase of analysis, a series of mitigation and adaptation activities have been identified, and no risks have been determined that – as regards their valuation over the time covered by the Business plan – may cause a need to make write-downs on the Group’s assets.
| Type | The Group’s main initiatives/actions |
|---|---|
| Mitigation activity |
|
| Adaptation activity |
|
As mentioned in paragraph 1.01.02, “Strategic approach and management policies - climate and the environment: sustainable development", Hera implements a risk management policy aimed at achieving carbon neutrality. The main contributions include energy efficiency solutions through the valorisation of multi-business assets, applied both within the Group and to customers, the development of new renewable plants, the sale of green energy to customers and a strong commitment to reduce carbon dioxide emissions from the industrial chain by 37% within 2030 (compared to 2019), calculated according to the Science Based Target method.
Identifying operational and ICT security risks
Despite careful planning and insurance protection, negative externalities generated by exceptional events may jeopardise business continuity and increase the financial requirements for restoring normal operations. The provision of public utilities therefore requires both preventive activities and actions to counter interruptions, delays or poor service levels. Technological risks include the operational security of distribution networks (fluids and electricity), the logical security of information, the security of communication networks and information systems, and the reliability of remote-control systems. The main threats to on-premise systems (hosted in company data centres) or in the cloud include identity theft, phishing aimed at taking control of a personal computer and then attacking central systems, and attacks on exposed services such as public websites.
The security of the information used, produced and processed by the company depends on the way it is managed and the human and technological resources involved. The loss of confidentiality, integrity and availability of corporate information, whether business-critical information or personal information (i.e. any data relating to natural persons, as more fully defined by the European regulation GDPR and the privacy code of Legislative Decree 196/03) may result in serious financial losses with consequent damage to market image. A business impact analysis has been carried out on all ICT systems (BIA) used by the Group, and a Security Risk Analysis is carried out annually to identify and assess risk, using a methodology based on a framework that considers three areas of security: availability, integrity and confidentiality.
Managing operational and ICT security risks
Centralised network monitoring systems (remote control of fluids and the electricity network) ensure continuous real-time monitoring and supervision and, in some areas, remote management, making it possible to promptly report potential critical factors to the technical structures in charge of emergency response and, where possible, to intervene directly to resolve the potential critical situation. These systems have been used in a variety of situations, allowing the service to be restored within an appropriate timeframe and ensuring adequate resilience of the services offered.
The Group constantly monitors the level of IT security risk, runs tests to continually assess the level of penetrability of its systems and network security, and carries out training campaigns to raise awareness among all users.
During 2021, work continued on measures aimed at ensuring the confidentiality, integrity and availability of Hera’s systems. The main initiatives, a consolidated part of the Group’s strategy and its method of action, are described in paragraph 1.01, “Contexts and trends, strategic approach and Group management policies”. By way of example, in the context of industrial plants, coordination of cybersecurity improvement initiatives has been boosted, aimed at a single monitoring model for cybersecurity covering both IT (Information Technology) and OT (Operation Technology) areas. In order to block any vulnerabilities in systems or applications that could be exploited by an attacker, vulnerability assessment activities have also been intensified, extending them to industrial plants.
During 2021, the Group received two complaints relating to issues of privacy or data loss from its customers.
Identifying people’s safety and development risks
People and their behaviour are the common denominator in the areas of climate, environment, technology and human capital, and they can increasingly influence the effectiveness of corporate strategies. The protection of people thus remains a key element that must be reflected in workplace safety and at the level of social protection. Hazard identification and risk assessment are based on analysing the roles, work activities, processes, workplaces, equipment, vehicles, plants and substances used. The Group continually focuses on the emerging needs and requirements of different categories of employees. With reference to the specific nature of its business and its geographical presence, the Group has established criteria for identifying risk scenarios due to the spread of the Covid-19 virus using an Enterprise risk management rationale. The measures adopted and their implementation are periodically monitored. To this end, a specific checklist has been developed for periodic monitoring, by the managers of the various organisational units. Lastly, with the aim of identifying, measuring and monitoring the risks threatening the Group’s assets, and preventing and mitigating threats and impacts caused by fires, regardless of the causes that may cause them (malicious, culpable or accidental), a risk assessment model has been implemented for the physical security of assets.
Managing people’s safety and development risks
In order to ensure worker health and safety and mitigate on-the-job injury risk, the Group is constantly committed to measures promoting better monitoring as well as to the enhancement of safety protection and prevention practices aimed at reducing the frequency and severity of accidents. The teaching methods chosen for worker training will no longer be solely technical or normative, but will be geared towards developing self-awareness in the perception of risk and in adopting safe and aware behaviour. The prevention measures put in place by the Group aim to lower the probability of an adverse event occurring, and the protection measures act by lowering the severity of the consequences following the event. It is of fundamental importance for the company to develop workers’ awareness of the risks associated with their work. Hera is increasingly using training courses that encourage people to develop greater awareness, modifying their own behaviour in terms of risk perception and being a virtuous example for other workers.
Focusing on these aspects is an essential element of operations, in order to maintain a steady decrease in the number of injuries, the accident frequency rate, the severity rate and the number of days of absence due to injury. In this respect, the Group has been granted important awards on occupational health and safety such as ISO 9001 (quality management system), ISO 14001 (environmental management system) and ISO 45001 (health and safety on the workplace). The process of hazard identification and risk assessment and control is carried out in a preventive and proactive (rather than reactive) manner, in order to identify appropriate risk reduction and control measures.
The ongoing commitment shown by people and the integration of safety into processes and training are the cornerstones of the Group’s safety culture. This strategic element of risk management is based on the premise that everyone is responsible for their own health and safety, as well as that of the people with whom they interact. This principle has been included in the procedure for managing the process of identifying hazards and assessing risks to the health and safety of workers. This procedure provides that each employee promptly report and halt any risky situation or unsafe behaviour. In addition, in 2021, the heads of the organisational units completed and managed about 7,000 checklists, instrumental in monitoring the measures adopted and the possible need for specific procedures for managing workers. As regards the health emergency caused by Covid-19, in order to promptly interrupt any chains of transmission of the virus in the workplace, under certain conditions, for example, rapid tests were carried out, additional activities accompanying the standard ones in cleaning and sanitising company premises were planned, providing for the use of disinfectants and intensifying their frequency, disinfectant gel dispensers were placed in the entrances and common areas, and surgical masks were distributed to each employee. In shared areas, a logistic management of the spaces was defined that allows an adequate distance between people. Finally, ways of carrying out services in the field were defined, such as reducing travel, eliminating the use of changing rooms or revising work shifts to reduce overlapping between operational teams.
In order to maintain a high level of efficiency in carrying out its activities and guarantee the highest level of safety in the workplace and compliance with environmental standards, and reduce risks related to the continuity of services, Hera has drawn up a technical-management project that:
For example, to better manage events, the Group’s synergies, skills and resources have been made use of by centralising the alarm reception point in a control room with a view of all alarms/alerts concerning assets, and also by managing the global contractor’s networks and systems (for installation and maintenance of systems, and activation of surveillance services). Finally, with reference to social wellbeing, with the aim of fostering a positive working environment, Hera has created a welfare system based on attention to people. This system includes interventions which are monetary or linked to the quality of life, such as services relating to the family, education, work-life balance, wellbeing, leisure and health.
The Hera Group ended the 2021 financial year with growth in operating-financial results compared to the previous year. The Group’s financial solidity, its pursuit of sustainable development and creating shared value for local areas and the communities served were confirmed as strong points.
The results for 2021 are part of an uninterrupted path of growth, firmly based on Hera’s consolidated multi-business industrial strategy, which relies equally on internal growth and development through external lines. A balanced combination of regulated and freely competitive activities, along with attention towards external opportunities and a commitment to sustainable development, in line with European strategies and the UN’s 2030 Agenda, continue to represent the founding elements of the Group’s growth.
With respect to 2020, two companies were integrated into the Hera Group’s waste management area, thus making a contribution towards increasing its commercial presence in the Central-Northern Italy: the acquisition of 70% of Recycla Spa, a Friuli-based company that manages three industrial waste platforms; and the purchase of 80% of the Vallortigara Group, which provides services to industries, public administrations and citizens and manages a multifunctional platform for the treatment of special waste. The energy areas benefited from AresGas Ead’s acquisition of 100% of the Bulgarian company Atlas Utilities, which holds 96.9% of Primagas, and the acquisition of 90% of Eco Gas Srl by Hera Comm Spa. For further information, see paragraph 1.03, “Main events occurred”.
Also note that Hera Comm Spa was awarded the gradual protection service for electricity supply to SMEs in 9 Italian regions. Detailed information on this issue is provided in paragraph 1.07.02.
Lastly, growth in value-added services offered to customers was recorded thanks to the development of the company Wolmann Spa. which operates in the photovoltaic panel installation sector.
The following table shows operating results at 31 December 2021 and 2020:
|
Income statement (mn€) |
Dec 21 |
% inc. |
Dec 20 |
% inc. |
Abs. change |
% change |
|---|---|---|---|---|---|---|
|
Revenues |
10,555.3 |
|
7,079.0 |
|
3,476.3 |
49.1% |
|
Other operating revenues |
400.1 |
3.8% |
467.8 |
6.6% |
(67.7) |
(14.5)% |
|
Raw and other materials |
(6,668.5) |
(63.2)% |
(3,410.6) |
(48.2)% |
3,257.9 |
95.5% |
|
Service costs |
(2,464.6) |
(23.3)% |
(2,424.9) |
(34.3)% |
39.7 |
1.6% |
|
Other operating expenses |
(66.5) |
(0.6)% |
(58.9) |
(0.8)% |
7.6 |
12.9% |
|
Personnel costs |
(592.8) |
(5.6)% |
(572.7) |
(8.1)% |
20.1 |
3.5% |
|
Capitalised costs |
60.8 |
0.6% |
43.3 |
0.6% |
17.5 |
40.5% |
|
Ebitda |
1,223.9 |
11.6% |
1.123.0 |
15.9% |
100.9 |
9.0% |
|
Amortization, depreciation and provisions |
(612.1) |
(5.8)% |
(571.7) |
(8.1)% |
40.4 |
7.1% |
|
Ebit |
611.7 |
5.8% |
551.3 |
7.8% |
60.4 |
11.0% |
|
Financial operations |
(119.8) |
(1.1)% |
(116.7) |
(1.6)% |
3.1 |
2.7% |
|
Pre-tax result |
491.9 |
4.7% |
434.6 |
6.1% |
57.3 |
13.2% |
|
Taxes |
(131.8) |
(1.2)% |
(111.8) |
(1.6)% |
20.0 |
17.9% |
|
Net result |
360.1 |
3.4% |
322.8 |
4.6% |
37.3 |
11.6% |
|
Result from special items |
12.6 |
0.1% |
‐ |
0.0% |
12.6 |
100.0% |
|
Net profit for the period |
372.7 |
3.5% |
322.8 |
4.6% |
49.9 |
15.5% |
|
Attributable to: |
|
|
|
|
|
|
|
Parent company shareholders |
333.5 |
3.2% |
302.7 |
4.3% |
30.8 |
10.2% |
|
Non-controlling interests |
39.1 |
0.4% |
20.1 |
0.3% |
19.0 |
94.6% |
REVENUES
(bn/euro)
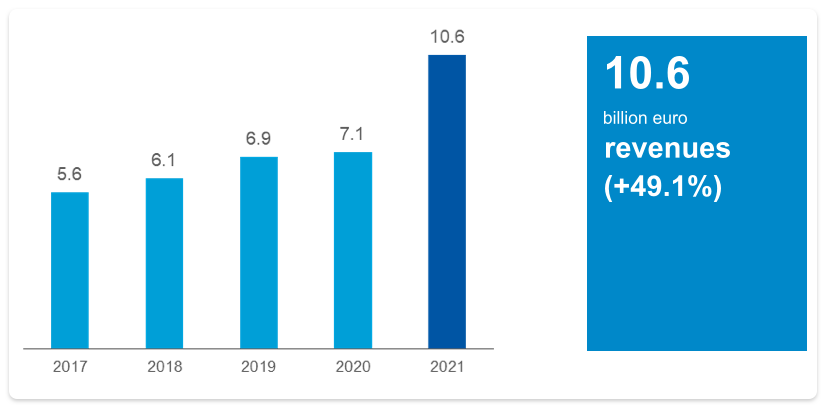
Revenues increased by 3,476.3 million euro, or 49.1%, compared to 2020. The energy sectors showed significant growth, amounting to 3,007 million euro overall, due to increased brokerage, coming to 2,068 million euro, and higher gas sales totalling 554 million euro due to higher volumes sold and the increase in the price of gas as a raw material. Electricity sales activities were also up, coming to 385 million euro overall, due to the higher price of raw materials, higher revenues from electricity generation, achieved despite a drop in volumes sold, and lower revenues from off-grid transmission and system charges.
Also note the growth in energy services related to energy efficiency works on residential buildings (insulation bonus and 110% super-bonus) and the increase in value-added services for customers, with an overall contribution coming to roughly 243.0 million euro.
Revenues from the waste management sector also increased by approximately 134 million euro, due to energy production, higher plastics sales and acquisitions in the industrial market. Revenues from network services, both regulated and subcontracted, came to roughly 74 million euro and revenues from the public lighting service for the resumption of activities and telecommunications amounted to approximately 18 million euro.
For further details, see the analysis of the individual business areas in paragraph 1.07.
Other operating income decreased by 67.7 million euro, or 14.5%, compared with the previous year. This trend is mainly due to lower energy efficiency contributions coming to approximately 129 million euro, as a result of the ministerial decree of 21 May 2021 redetermining the obligations of energy efficiency certificates (for further information, see paragraph 1.07.01). These amounts were offset by higher revenues from contracts for assets under concession, coming to roughly 50 million euro. Lastly, higher other revenues were mainly related to higher value-added services, innovative solutions and increased incentives supporting the circular economy, the reduction of urban waste production and sorted waste collection.
The cost of raw and other materials increased by 3,257.9 million euro compared to December 2020. This increase mirrors the trend in revenues from energy activities. In addition, purchasing costs for plastic materials also increased, due to the higher volumes sold. This trend was partially offset by lower purchasing costs for energy efficiency certificates, following the ministerial decree mentioned above.
Other operating costs increased by a total of 47.3 million euro (39.7 million euro in higher service costs and 7.6 million euro in higher operating expenses). Also note the higher costs in energy services for energy efficiency works coming to approximately 192 million euro, higher costs for incremental improvements to assets under concession and works on behalf of third parties amounting to approximately 60 million euro, higher costs for waste collection and treatment coming to approximately 43 million euro and higher costs for value-added services totalling approximately 6.0 million euro. The growth indicated above was partially offset by lower costs for off-grid transmission and system charges coming to approximately 258 million euro.
In addition, compared to the previous year, there was a resumption of work and site activities that had been blocked due to the lockdown following the Covid-19 pandemic.
Personnel costs increased by 20.1 million euro, or 3.5%. This increase is linked to the salary increases provided for in the national collective bargaining agreement, the lower benefits due to the large-scale holiday plan adopted by the Group last year in conjunction with the national lockdown and changes in the scope of consolidation compared to December 2020. These effects were only partially contained by a lower average presence.
Capitalised costs increased by 17.5 million euro due to higher capital expenditure on assets owned by the Group and between the companies themselves.
EBITDA
(mn/euro)
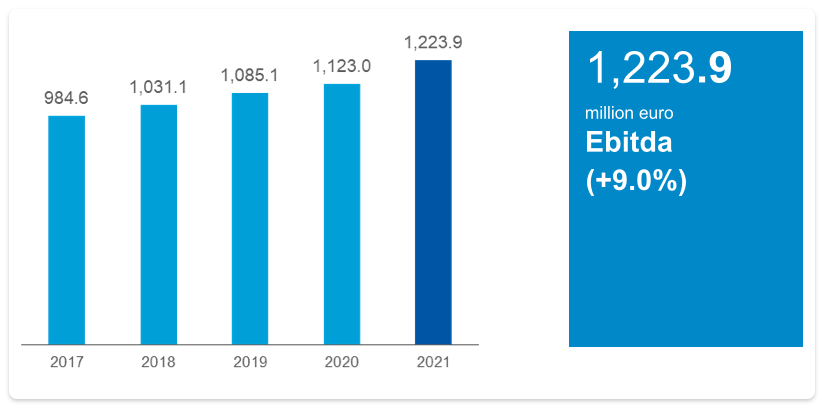
Ebitda increased by 100.9 million euro, or 9.0%. This growth was due to the performance of the energy areas, which together rose by 69.7 million euro, accounting for approximately 52% of Group results. The waste management area grew by 33.8 million euro, while the other services area increased by 0.7 million euro. Lastly, the water cycle area showed a decrease of 3.3 million euro.
For further details, see the analysis of the individual business areas.
Depreciation, amortisation and provisions at 31 December 2021 increased by 40.4 million euro, or 7.1%, on the previous year. The increase in depreciation and amortisation was mainly due to new investments in the operating sectors, an increase in commissions in the sales companies and changes in the scope of consolidation resulting from the entry of companies involved in sales of gas, electricity and other energy products, as well as companies specialising in industrial waste management and environmental services. An overall increase was also seen in provisions for doubtful debts, in particular in Hera Comm Spa, due to the award of gradual protection service lots.
EBIT
(mn/euro)
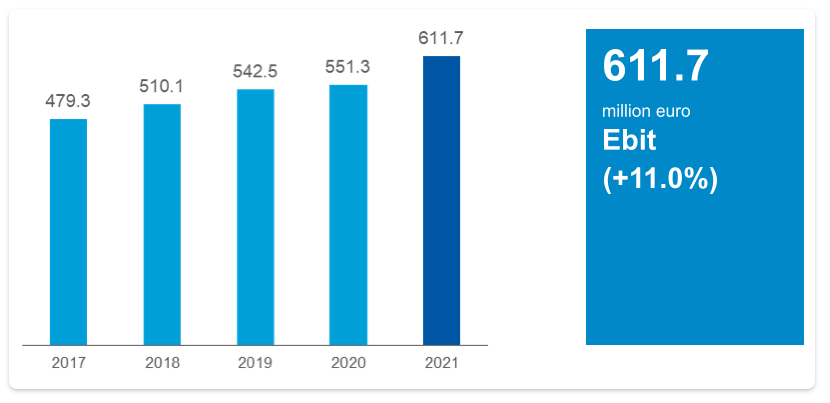
Ebit increased by 60.4 million euro, or 11.0%; the increase resulting from the growth in Ebitda was reduced by higher depreciation and amortisation, as described above.
The result of financial operations at 31 December 2021, which came to 119.8 million euro, worsened by 3.1 million euro, or 2.7%, compared to 31 December 2020. This change is due to higher charges amounting to approximately 25.7 million euro related to the sale of tax credits due to Hera Group companies, Hera Servizi Energia and AcegasApsAmga Servizi Energetici, as part of the eco-bonus incentive operating activities, largely offset by the benefits coming from lower interest on bonds and loans coming to 4.2 million euro, obtained thanks to debt optimisation operations that saw a partial repurchase of some bonds, by 4.2 million euro for lower charges deriving from the closure of a litigation, by 5.7 million euro for lower notional charges deriving mainly from discounting post-mortem costs of landfills, and by 5.0 million euro due to higher profits from associates and joint ventures.
Pre-tax profit increased by 57.3 million euro, or 13.2%; the increase coming from higher Ebit was further boosted by the reasons described above.
Taxes for the year increased from 111.8 million euro in 2020 to 131.8 million euro in 2021. The tax rate came to 26.8%, compared to 25.7% one year earlier. In this comparison, note that both tax rates take into account the benefits accounted for following the redemption of some higher values, originating from an equal number of acquisition transactions carried out in the respective years. On this matter, and for further details, see note 12 on taxes in paragraph 2.02.05 “Commentary notes to the financial statement formats”. Without taking into account these effects, the tax rate for the year 2021 would have been slightly lower than in the previous year. This positive result was mainly due to the benefits received in terms of large and extremely large amortisations, involving the significant investments made by the Group in relation to the technological, digital and environmental transformation.
The net result rose by 11.6%, reaching 37.3 million euro; the increase coming from the pre-tax profits was reduced by higher taxes.
In 2021, there was a result from special items with a total value of 12.6 million euro. A detailed description of its contents is provided at the beginning of paragraph 1.07, “Overview of operating and financial trends and definition of APMs”.
Net profit therefore increased by 15.5%, or 49.9 million euro, due to the sum of all the events described above.
NET PROFIT POST MINORITIES
(mn/euro)
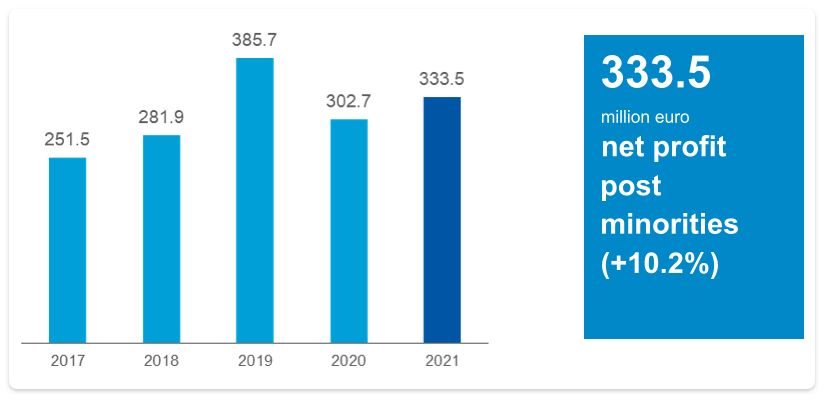
Profits pertaining to the Group rose by 30.8 million euro, or 10.2%, compared to 2020.
In 2021, the Group’s net investments came to 570.3 million euro, up 41.8 million euro on the previous year. This includes financial investments amounting to 11.0 million euro, mainly involving the equity investment in the company SEA - Servizi Ecologici Ambientali Spa, down 35.9 million euro compared to the financial investments made during the previous year, which included the equity investment in Ascopiave Spa.
Capital grants amounted to 29.4 million euro, of which 16.8 million euro in FoNI investments, as provided for by the tariff method for the integrated water service. Net operating investments amounted to 559.2 million euro, up by 77.5 million euro compared to the previous year.
The following table provides a breakdown by business area, with separate mention of capital grants:
|
Total investments (mn€) |
Dec 21 |
Dec 20 |
Abs. change |
% change |
|---|---|---|---|---|
|
Gas area |
141.3 |
135.3 |
6.0 |
+4.4% |
|
Electricity area |
55.3 |
47.7 |
7.6 |
+15.9% |
|
Integrated water cycle area |
194.6 |
166.2 |
28.4 |
+17.1% |
|
Waste management area |
98.2 |
68.3 |
29.9 |
+43.8% |
|
Other services area |
14.6 |
11.1 |
3.5 |
+31.5% |
|
Headquarters |
84.8 |
77.9 |
6.9 |
+8.9% |
|
Total gross operating investments |
588.7 |
506.4 |
82.3 |
+16.3% |
|
Capital grants |
29.4 |
24.8 |
4.6 |
+18.5% |
|
of which FoNi (New Investments Fund) |
16.8 |
13.6 |
3.2 |
+23.5% |
|
Total net operating investments |
559.2 |
481.7 |
77.5 |
+16.1% |
|
Financial investments |
11.0 |
46.9 |
(35.9) |
(76.5)% |
|
Total net investments |
570.3 |
528.5 |
41.8 |
+7.9% |
TOTAL NET OPERATING INVESTMENTS
(mn/euro)
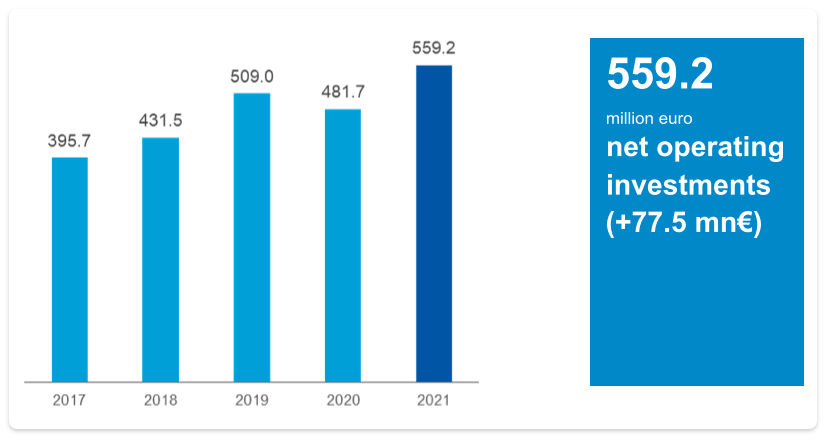
Including capital grants, the Group's operating investments amounted to 588.7 million euro, up 82.3 million euro on the previous year, and mainly related to works on plants, networks and infrastructures. In addition, regulatory upgrading was done, especially in the gas distribution sector for the large-scale metre replacement, and in the purification and sewage sector.
Comments on investments in the individual areas are provided in the analysis by business area.
At Group headquarters, investments concerned interventions on corporate buildings, IT systems and the vehicle fleet, as well as laboratories and remote control structures. Overall, investments in structures increased by 6.9 million euro compared to the previous year, mainly due to work on corporate buildings and the vehicle fleet.
What follows in an analysis of trends in the Group’s net invested capital and sources of financing at 31 December 2021.
|
Invested capital and sources of financing (mn€) |
Dec 21 |
% inc. |
Dec 20 |
% inc. |
Abs. change |
% change |
|---|---|---|---|---|---|---|
|
Net non-current assets |
7,308.0 |
+109.4% |
6,983.6 |
+109.4% |
324.4 |
+4.6% |
|
Net working capital |
3.5 |
+0.1% |
53.6 |
+0.8% |
(50.1) |
(93.5)% |
|
(Provisions) |
(633.4) |
(9.5)% |
(654.9) |
(10.3)% |
21.5 |
+3.3% |
|
Net invested capital |
6,678.1 |
+100.0% |
6,382.3 |
+100.0% |
295.8 |
+4.6% |
|
Equity |
(3,416.8) |
+51.2% |
(3,155.3) |
+49.4% |
(261.5) |
(8.3)% |
|
Long-term borrowings |
(3,633.1) |
+54.4% |
(3,617.1) |
+56.7% |
(16.0) |
(0.4)% |
|
Net current financial debt |
371.8 |
(5.6)% |
390.1 |
(6.1)% |
(18.3) |
(4.7)% |
|
Net debt |
(3,261.3) |
+48.8% |
(3,227.0) |
+50.6% |
(34.3) |
(1.1)% |
|
Total sources of financing |
(6,678.1) |
(100.0)% |
(6,382.3) |
(100.0)% |
(295.8) |
(4.6)% |
The year 2021 closed with net working capital coming to 3.5 million euro, down from 53.6 million euro at the end of 2020, thus showing no particular impact from the health crisis. This decrease is mainly due to the good performance of trade receivables, thanks to the continuous and attentive control of credit management processes, and the increase in payables for invoices to be received due to the increase in raw material prices.
In 2021, provisions amounted to 633.4 million euro, down from 654.9 million euro seen at the end of the previous year. This change is mainly due to the reclassification of the provision for restoration of third-party assets, coming to 39.3 million euro, among current financial payables, following the awarding of the new tender for managing the water service in the province of Rimini. For details on changes in provisions, see the information contained in paragraph 2.02.05, “Commentary notes to the financial statement formats”.
Equity increased from 3,155.3 million euro in 2020 to 3,416.8 million euro in 2021. Equity increased the Group’s solidity, thanks to the positive net result of management in 2021, coming to 372.7 million euro, and the effect of cash flow hedge reserves, offset by the impact of dividend payments.
Return on net invested capital (ROI) settled at 9.2% in 2021, up from 2020 ROI by 8.6%, due to the positive result from operations (Ebit), which increased more than proportionally with respect to the increase in net invested capital (NIC).
ROI
(%)
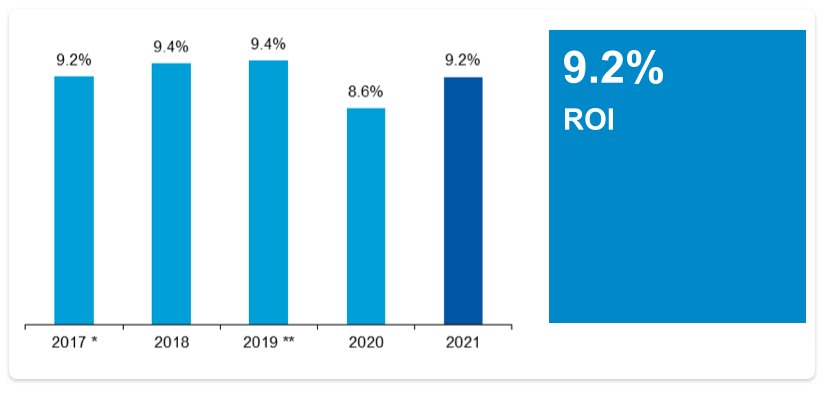
* adjusted for non-recurring entries
** adjusted for non-recurring entries and the Ascopiave transaction
The positive operating result led to a return on equity (ROE) coming to 10.5%, up from 2020.
ROE
(%)
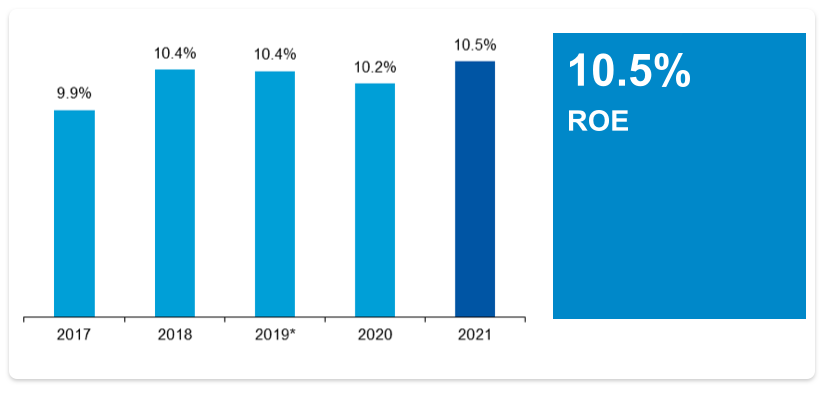
* adjusted for non-recurring entries and the Ascopiave transaction
An analysis of adjusted net financial debt is shown in the following table:
|
mn€ |
|
31 Dec 21 |
31 Dec 20 |
|---|---|---|---|
|
A |
Cash |
885.6 |
987.1 |
|
B |
Cash equivalents |
- |
- |
|
C |
Other current financial assets |
29.3 |
32.8 |
|
D |
Liquidity (A+B+C) |
914.9 |
1,019.9 |
|
E |
Current financial debt |
(443.6) |
(302.6) |
|
F |
Current portion of non-current financial debt |
(99.5) |
(327.2) |
|
G |
Current financial indebtedness (E+F) |
(543.1) |
(629.8) |
|
H |
Net current financial indebtedness (G-D) |
371.8 |
390.1 |
|
I |
Non-current financial debt |
(461.0) |
(594.2) |
|
J |
Debt instruments |
(2,702.0) |
(2,554.3) |
|
K |
Non-current trade and other payables |
‐ |
‐ |
|
L |
Non-current financial indebtedness (I+J+K) |
(3,163.0) |
(3,148.5) |
|
M |
Total financial indebtedness (H+L) |
(2,791.2) |
(2,758.4) |
|
|
Non-current financial receivables |
142.7 |
14.,8 |
|
|
Net financial debt (excluding put option) |
(2,648.5) |
(2,617.6) |
|
|
Nominal amount - fair value put option |
(474.2) |
(456.4) |
|
|
Net financial debt with adjusted put option |
(3,122.7) |
(3,074.0) |
|
|
Portion of future dividends - fair value put option |
(138.6) |
(153.0) |
|
|
Net financial debt (Net debt) |
(3,261.3) |
(3,227.0) |
The total amount of net financial debt came to 3,261.3 million euro, up approximately 34.3 million euro compared to the previous year.
The financial structure shows a current financial indebtedness coming to 543.1 million euro, of which 99.5 million euro refers to the current portion of non-current financial debt, which includes 56.1 million euro as the portion of medium-term bank loans falling due within one year and 43.4 million euro in leasing debts falling due. The portion of current debt due to other financial institutions amounted to 378.7 million euro, including 266.5 million euro for cash advances from commodity derivatives and 39.3 million euro for payables related to the provision for the restoration of third-party assets, to be paid following the award of the new tender for managing the water service in the province of Rimini. Bank payables included in current financial indebtedness refer to 41.5 million euro in interest expense on loans and 23.3 million euro in utilisations of current account lines.
The amount related to non-current payables and bonds issued increased mainly due to the total net effect of the issue of the first Sustainability-linked bond (under the Euro Medium Term Notes Programme), amounting to 500 million euro, and the partial repurchase of five bonds, for a total nominal value of 405 million euro, as well as repayments and adjustments in the current portion of other residual loans. The bond, which is part of the Group’s sustainability strategy aimed at reducing emissions and recycling plastics, is linked to achieving the sustainability targets set out in the Sustainability-linked financing framework, and has a term of 12.5 years with an annual fixed-rate coupon of 1%. Starting from the 2032 interest payment date, a possible increase in the interest rate is foreseen, in the event that the Group does not achieve the targets for reducing greenhouse gas emissions in tonnes of CO2 (rate increase of 0.20%) and/or the quantity of recycled plastic in thousands of tonnes (rate increase of 0.15%). More details on the new bond can be found in section 1.03, “Main events occurred” of the Directors’ Report.
Cash decreased, going from 987.1 million euro in 2020 to 885.6 million euro in 2021.
At 31 December 2021, 85.8% of medium- and long-term debt consisted in bonds with repayment at maturity. Total debt showed an average time to maturity of approximately seven years, with 65.8% maturing after over five years.
Net financial debt rose by 34.3 million euro, going from 3,227.0 million euro in 2020 to 3,261.3 million euro in 2021.
NET FINANCIAL DEBT
(bn/euro)
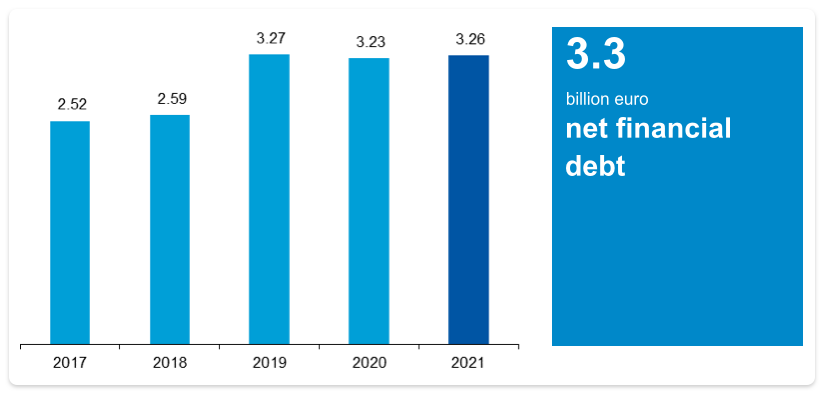
The Group’s characteristic management generated positive operating cash flows coming to 379.9 million euro, which entirely financed dividend payments and contributed to financing almost all of the shareholding acquisitions. Among the latter, note the purchase of 70% of Recycla Spa and 80% of the Group by Herambiente Servizi Industriali Srl, 90% of Eco Gas Srl by Hera Comm Spa and, furthermore, 11% of Ascotrade Spa by EstEnergy Spa.
CASH FLOW
(mn/euro)
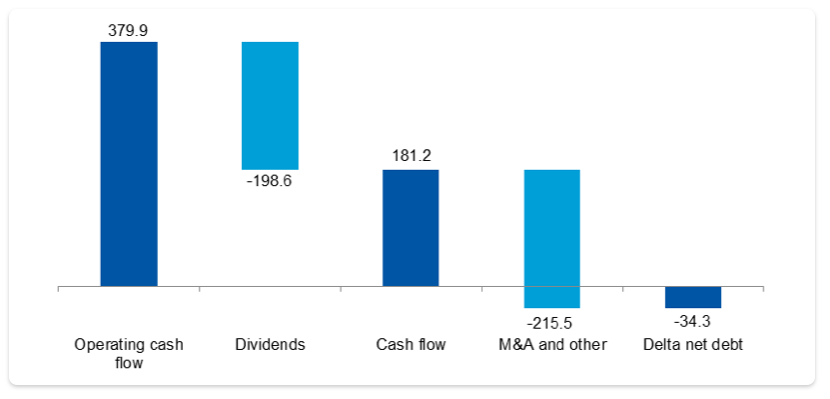
The Net debt/Ebitda ratio for 2021 fell to 2.66x, compared to 2.87x in 2020.
NET DEBT/EBITDA
(X)
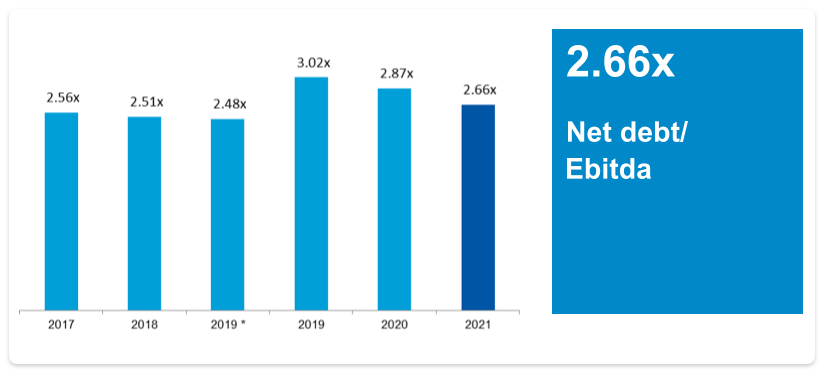
* adjusted for non-recurring entries and the Ascopiave transaction
The Funds from operations (FFO)/Net debt ratio settled at 26.7%, confirming the Group’s financial solidity and its ability to meet its financial obligations, thanks to the positive trend in operating cash flow.
FFO/NET DEBT
(%)
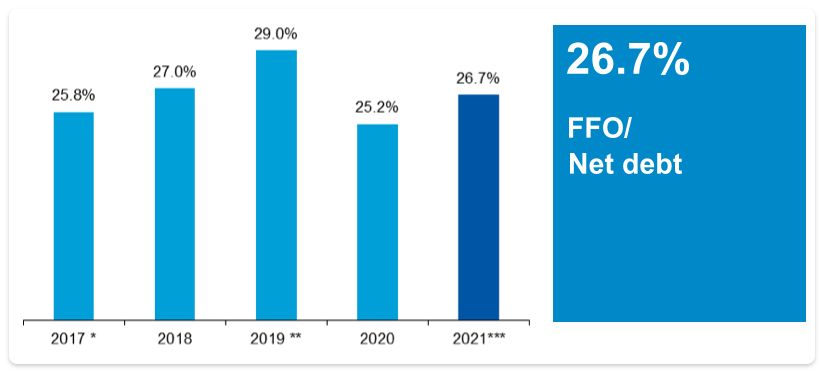
* adjusted for non-recurring entries
** adjusted for non-recurring entries and the Ascopiave transaction
*** amount net of special items
The Group’s commitment to reporting to stakeholders as to the results achieved in the areas of creating shared value (CSV) and sustainability was confirmed once again this year by its Sustainability Report, available at bs.gruppohera.it and on the Group’s website in the sustainability section.
The Sustainability Report contains the Hera Group’s consolidated non-financial statement prepared pursuant to legislative decree 254/16 and constitutes a separate report from this Directors’ report, as provided for in Article 5, paragraph 3, letter b) of legislative decree 254/16. The Sustainability Report also includes indicators and information relating to the environment, personnel and research and development activities.
What follows is a summary of the main results reported in the 2021 Sustainability Report.
During 2021, further progress was made in CSV areas and as regards sustainability, both in terms of results achieved and new projects launched, and in terms of measurement and reporting. With regard to the latter aspects, several elements enriched the Group’s sustainability and accountability profile:
The 2021 Sustainability Report consolidates its representation of content focused on creating shared value. The results achieved and the objectives set for the future are accompanied by a summary of the scenario relating to the three drivers for creating shared value:
An equal number of chapters are dedicated to these three areas, representing the most significant part of the report.
One of the strengths of the Group’s reporting is its quantification of shared value Ebitda (CSV Ebitda), i.e. the portion of Ebitda that derives from business activities capable of meeting the objectives on the Global Agenda, which refers to calls to action for sustainable growth (relevant to the Group’s activities) summarised in the three drivers mentioned above.
In 2021, CSV Ebitda came to 570.6 million euro, corresponding to 46.6% of the Group’s total Ebitda, with a 25.4% increase compared to the amount seen in 2020, in line with the new calculation criteria, defined in order to take into account the European Taxonomy of eco-sustainable activities. CSV Ebitda for 2021 is thus in line with the path set out by the 2021-2025 Business Plan, which was designed to ensure that approximately 55% of 2025 Ebitda will come from business activities that meet the priorities on the Global Agenda. The Group’s contribution to creating shared value also involves making investments in the three CSV drivers, which in 2021 amounted to 452.7 million euro, approximately 68% of the total.
This quantification of shared value Ebitda and investments for 2021 has been submitted, for the third consecutive year, to an audit, with the aim of confirming these distinctive aspects of the Group’s reporting to all stakeholders.
Hera pursues the carbon neutrality of its own activities and those of its customers by promoting energy efficiency and projects in the area of the energy transition and renewable energy.
With regard to energy efficiency, note that:
With regard to the energy transition and renewable energies, Hera continued to promote its carbon-neutral commercial offer in 2021, achieving at the end of the year:
For the fourth consecutive year, Hera also continued to guarantee electricity 100% of which derives from renewable sources to all its residential customers in the free market, and in 2021 it enhanced its commercial proposition with the Hera Photovoltaic offer.
Internally, in 2021 Hera produced 8 million cubic metres of biomethane from the organic portion of waste (slightly more than in 2020) and covered 82% of its own consumption with electricity from renewable sources. In 2021, numerous initiatives were launched to develop hydrogen as an energy vector, aimed using it in hard-to-abate sectors, to introduce it into gas distribution networks and to construct a power-to-gas plant closely integrated with the wastewater treatment process.
Lastly, on the basis of the second report carried out in accordance with the SBTi methodology referred to above, the Group’s greenhouse gas emissions (Scope 1+2+3 from the sale of electricity and downstream natural gas) recorded an 11.6% reduction in 2021, compared with the 2019 base year, which is in line with the 2030 target validated by SBTi. More specifically, 2021 saw a reduction in Scope 1+2 (market-based) emissions and carbon intensity of electricity sales (Scope 3 upstream) coming to 9.1% and 27.7% respectively.
Hera regenerates resources and closes the circle through initiatives and projects in three areas: (i) transition towards a circular economy, (ii) sustainable management of water resources, (iii) protection of air, soil and biodiversity.
With regard to the transition to a circular economy, 2021 saw sorted waste collection come to 65.3% (Italian 2020 average: 63%) and use of landfills for the disposal of urban waste at 3.5% (European 2020 average: 23%). In this respect, Hera is almost 20 years ahead of the EU target for the circular economy and ranks among the most virtuous European countries. In October 2021, Hera published the eleventh edition of its “Tracking Waste” report, verified by DNV, thus providing citizens with a guarantee of the effective recovery of separate waste collection, which came to 90.5%. This report contains indications as to how the area served by Hera positions with respect to the recycling targets set by the EU as part of the circular economy package: the overall recycling rate, where Hera with 55% has already achieved the target set for 2025, and the packaging recycling rate, where the Group with 73% exceeds by three percentage points the target set for 2030.
Once again as regards the circular economy, 2021 saw an 80.8% material and energy recovery rate in Herambiente Spa’s sorting plants, and quantities of plastic recycled by the Aliplast Group coming to approximately 81 thousand tonnes, showing a 17.5% increase compared to 2020 and 36% compared to 2017, the baseline of the commitments made in the New Plastics Economy Global Commitment promoted by the Ellen MacArthur Foundation.
Concerning the sustainable management of water resources, in 2021 the Group’s commitment in the sewage sector continued with a multi-year plan to bring urban agglomerations into line with regulations. At the end of 2021, thanks to the expansion of the Borgheria (PU) purification plant, 99.6% of agglomerations were adequate in terms of population equivalent (97.6% in 2020). Initiatives to preserve water resources were also important, including the internal water management project, which enabled a 16.6% reduction in consumption in 2021 (compared to the 2017 baseline), agreements with local authorities that make 6% of the water leaving the purification plants reusable, and the aforementioned Consumption Log, which has been sent to around 27% of household water service customers.
As far as air protection is concerned, positive results were confirmed in relation to the environmental performance of the Group’s waste to energy plants, which in 2021 again recorded very low levels of atmospheric emissions, on average 86% lower than the legal limits, and the Imola cogeneration plant, with average PM10 concentrations 99% lower than the limits. Lastly, with regard to soil protection, note that from 2018 to 2021, the construction of infrastructures has led to a 78% reuse of soil.
In 2021, the Group achieved significant results in the CSV areas related to economic and employment growth in local areas, innovation and digitalisation; it also carried out important initiatives and projects aimed at ensuring the resilience of its operations and therefore of the areas served.
The total economic value distributed to the territory amounted to 2,224 million euro, equivalent to 75% of overall economic value. The amount distributed to local suppliers came to 67% of the total and reached 807 million (+9% compared to the previous year), while induced employment is estimated at approximately 9,300 people; these figures confirm the Group’s primary role in the development of the local area. With regard to induced employment, the employment of disadvantaged people (882) is reported as a result of supplies from social cooperatives amounting to 72.3 million euros in 2021.
In the area of innovation, investments amounted to more than 82 million euro and were related to initiatives in three areas: energy transition, circular economy and digital transformation. With regard to digital transformation, the 2021 Sustainability Report confirms reporting for 24 projects, introduced for the first time in the 2020 report, concerning objectives, results and impacts based on the framework of Corporate digital responsibility, defined as the set of practices and behaviours that help an organisation use data and digital technologies in an ethical and responsible manner, from a social, environmental, economic and technological point of view. In addition to digital transformation projects aimed at further optimising operating processes for the benefit of service quality, safety and continuity, work quality and internal efficiency, efforts continued in 2021 to develop digital channels for customer relations. The apps L'Acquologo and Il Rifiutologo reached 775,000 downloads by the end of 2021 and exceeded 140,000 photo-reports sent by citizens. The digitalisation of customer relations was also characterised by a constant increase in the number of practices managed online: in 2021, customers registered for online services rose to 27.1%, while those who requested an electronic bill reached 30.9%. The Group’s commitment in this area, combined with its focus on local communities, continued in 2021 with the fourth edition of the campaign to promote electronic bills and customers’ digital behaviour, called Digi e Lode, through which the Group from 2017 to 2021 donated 375 thousand euros for the digitalisation of 150 schools.
Once again as regards digitalisation, the experience gained by the Group since 2017 has made it possible to continue to manage the emergency situation in a resilient manner in 2021. The number of workers permanently involved in the remote working project in 2021 came to almost 4,200, 77% of the total number of permanent employees, excluding only blue collar workers.
The results achieved in 2021 in terms of shared value generated are complementary to those relating to the following areas, which complete the Group’s sustainability profile and are reported in the “Alongside the actors of change” section of the Sustainability Report:
During 2020, a path was designed to come into line with the recommendations of the Task Force on climate-related financial disclosures (TCFD), which involved the entire corporate organisation, across the board, and continued in 2021. This Task Force came into being as a result of the 2015 Paris Agreement, in which the member states of the United Nations committed to keeping the increase in the average global temperature below 2°C compared to pre-industrial levels, and possibly limiting the increase to 1.5°C by the end of the 21st century. In the same year, the G20 Financial Stability Board established the TCFD, with the aim of facilitating greater transparency on the financial opportunities and risks associated with climate change. In 2017, the TCFD published the reporting recommendations mentioned above, which are now an international reference for corporate climate change disclosure. The TCFD’s recommendations are applicable to organisations across all sectors and are classified into four areas: governance, strategy, risk management and metrics & targets.
The path along which the Group has set out was defined according to three main steps:
The EU taxonomy is a unique European classification system introduced by Regulation 2021/852, which establishes a list of environmentally sustainable economic activities. It is a classification tool provided for in the Action plan on sustainable finance, aimed at supporting the European Union in increasing sustainable investments and carrying out the Green Deal.
Following the recommendations of Delegated Regulation 2021/2178, which introduces obligations to disclose information about the taxonomy in NFD, a multi-step process was developed in 2021 to analyse the taxonomy’s applicability along the entire value chain, taking into account all of the Group’s consolidated companies.
This process exclusively concerned the climate change mitigation and adaptation objectives for which Delegated Regulation 2021/2139 introduces a list of activities that contribute substantially to these objectives, and the list of technical screening criteria that these activities must meet in order to be classified as environmentally sustainable.
In compliance with the disclosure requirements set out for 2021 NFD, this process has allowed for quantification of and reporting on the economic KPIs (turnover, opex and capex) of the activities managed by the Hera Group that are eligible for the taxonomy, i.e. those activities included in the list provided for in Regulation 2139, regardless of whether they meet the technical screening criteria.
Despite the fact that the Taxonomy Regulation establishes the obligation to report in 2023 the amount of turnover, opex and capex of the activities aligned with the taxonomy, i.e. those activities that meet the technical screening criteria, the Hera Group has committed to disclose, regarding the mitigation objective, already in its 2021 non-financial reporting. In addition, it has decided to include, alongside the economic KPIs, the amount of Ebitda deriving from the activities aligned with the taxonomy (flanking and complementing CSV Ebitda) and to introduce in its 2021-2025 Business Plan the amount of investments in these activities.
See the Sustainability Report for a comprehensive discussion of this topic.
An analysis of the operating results achieved in the Group’s business areas is provided below, including: the gas area, which covers services in natural gas distribution and sales, district heating and heat management; the electricity area, which covers services in generation, distribution and sales; the integrated water cycle area, which covers aqueduct, purification and sewerage services; the waste management area, which covers services in waste collection, treatment and recovery; the other services area, which covers services in public lighting and telecommunications, as well as other minor services.
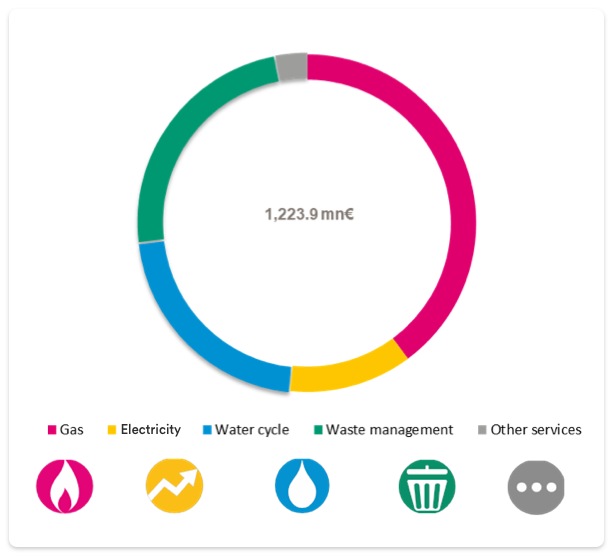
The Group’s income statements include corporate headquarter costs and account for intercompany transactions at arm’s length.
The following analyses of each single business area take into account all increased revenues and costs, having no impact on Ebitda, related to the application of IFRIC 12. The business areas affected by this accounting standard are: natural gas distribution services, electricity distribution services, all integrated water cycle services and public lighting services.
Gas
Significant growth was seen in 2021 compared to 2020, both in terms of margins and volumes sold, thanks to the opportunities provided in the Energy Services segment by energy efficiency incentives, the 110% super-bonus and insulation bonus, as well as the recovery in consumption and production, which had slowed down considerably in 2020 due to the Covid-19 pandemic. In addition, benefits were related to energy efficiency certificates, district heating and sales markets in all areas served. In particular, in last resort markets, Hera Comm Spa was awarded the following lots nationwide through tenders:
EBITDA GAS AREA 2021
|
EBITDA GAS AREA 2020
|
The following table shows the changes occurred in terms of Ebitda:
|
(mn€) |
Dec 21 |
Dec 20 |
Abs. change |
% change |
|---|---|---|---|---|
|
Area Ebitda |
487.6 |
374.4 |
113.2 |
+30.2% |
|
Group Ebitda |
1,223.9 |
1,123.0 |
100.9 |
+9.0% |
|
Percentage weight |
39.8% |
33.3% |
+6.5 p.p. |
|
CUSTOMERS
(k)
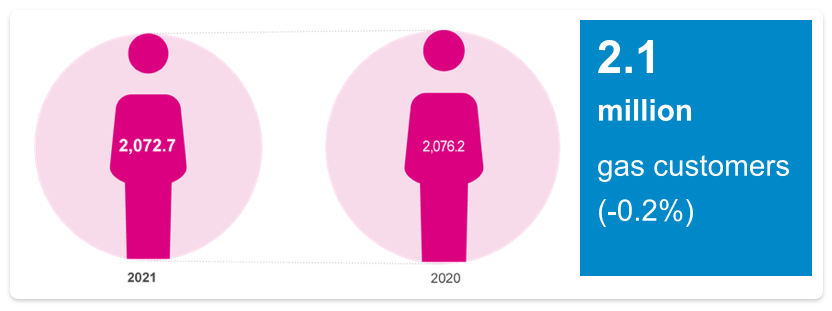
The number of gas customers decreased slightly by 3.6 thousand, or 0.2%, compared to the previous year. On traditional markets, the customer base was stable, while customers in the last resort markets, after the significant increase recorded in the last quarter of 2020 owing to tenders for the period 2020-2021, decreased by 4 thousand.
VOLUMES SOLD
(mn/m3)
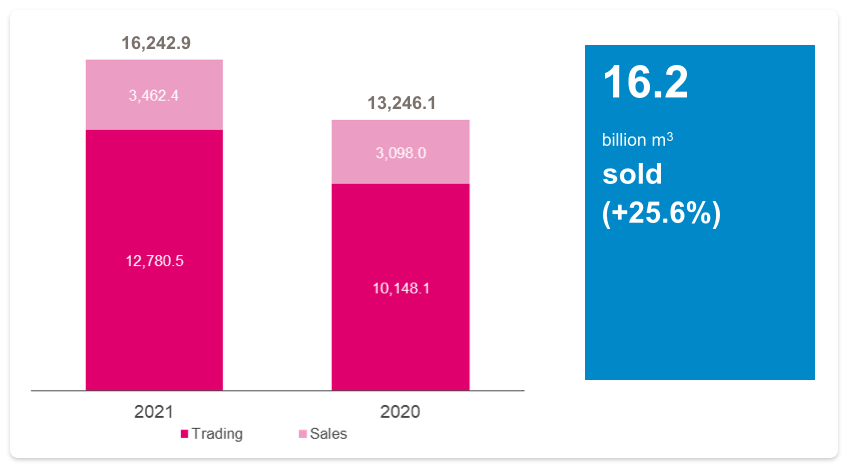
Total volumes of gas sold increased by 2,996.8 million m3, or 22.6%. Brokerage volumes were up by 2,632.4 million m3, or 19.9% of the total. Trading increased, in order to satisfy internal procurement and take advantage of market opportunities. Volumes sold to end customers increased by 11.8%, reaching 364.4 million m3, reflecting the aforementioned post-Covid-19 recovery. Traditional markets grew by 272.3 million m3 (+9.1%, or +8.8% of total volumes sold) and last resort markets by 92.1 million m3 (+96%, or +3.0% of total volumes sold).
The following table summarises operating results for the gas area:
|
Income statement (mn€) |
Dec 21 |
% inc. |
Dec 20 |
% inc. |
Abs. change |
% change |
|---|---|---|---|---|---|---|
|
Revenues |
5,969.0 |
|
3,361.3 |
|
2,607.7 |
+77.6% |
|
Operating costs |
(5,373.1) |
(90.0)% |
(2,883.4) |
(85.8)% |
2.489.7 |
+86.3% |
|
Personnel costs |
(126.9) |
(2.1)% |
(116.5) |
(3.5)% |
10.4 |
+8.9% |
|
Capitalised costs |
18.6 |
+0.3% |
13.0 |
0.4% |
5.6 |
+43.0% |
|
Ebitda |
487.6 |
8.2% |
374.4 |
11.1% |
113.2 |
+30.2% |
REVENUES
(mn/€)
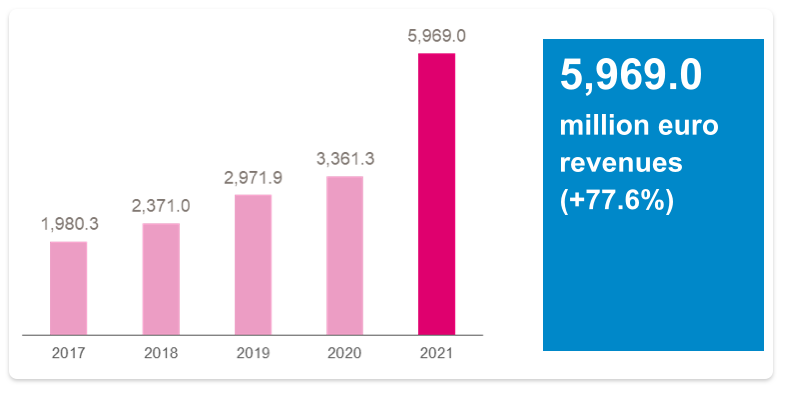
Revenues increased by 2,607.7 million euro, or 77.6%, compared to the previous year. The reasons for this are mainly to be found in brokerage, which generated higher revenues coming to 1,870 million euro, and higher volumes sold, coming to 120 million euro.
The increase in the price of gas as a raw material accounted for 441 million euro, with a sharp rise beginning in October 2021. The CMEM tariff component, which in the protected market represents trends in the cost of raw materials, increased by 75% between December and September and by 245% compared to December 2020.
The higher revenues of the energy services business, due to activities linked to energy efficiency, the insulation bonus and the 110% super-bonus, were up by approximately 238 million euro. In addition, higher revenues came from district heating, totalling 28 million euro, due to higher prices and volumes sold, and for activities in Bulgaria, coming to 13 million euro.
This growth was limited by a drop in revenues from energy efficiency certificates, amounting to roughly 121 million euro, as a result of the 21 May 2021 Ministerial Decree. This decree, which regulates the determination of the national quantitative energy saving objectives for electricity and gas distribution companies for 2021-2024, operated retroactively, reducing the number of certificates allowed for the 2020 obligation year by 60%, as well as defining a significantly lower number of certificates for the 2021 obligation than in the past.
Regulated revenues increased by 2 million euro. From a regulatory point of view, since 2021 is the second year of the new regulatory period, there are no regulatory changes to mention. Therefore, the growth was essentially related to a natural update of the constraints, mainly involving the capex update.
This increase in revenues was proportionally reflected by growth in operating expenses, which increased by 2,489.7 million euro overall. This trend was mainly due to the increased activity in energy services and brokerage, higher volumes sold and lower costs for purchasing energy efficiency certificates.
EBITDA
(mn/€)
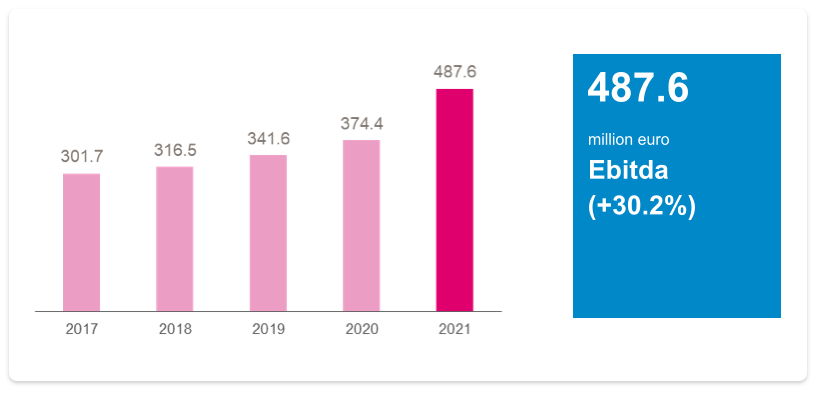
Ebitda increased by 113.2 million euro, or 30.2%, due to growth in incentivised energy efficiency activities coming to approximately 42 million euro, increased margins in the district heating business amounting to 4 million euro and white certificates totalling 6.6 million euro, due to the reduction in energy efficiency obligations described above. The remaining growth was related to sales activities, due to the recovery in consumption and the enlargement of the area served, in addition to brokerage on international markets. Also note the growth in margins of the gas business in Bulgaria, up 11%, with a corresponding increase of 4 thousand customers, or 17%.
NET INVESTMENTS GAS
(mn/€)
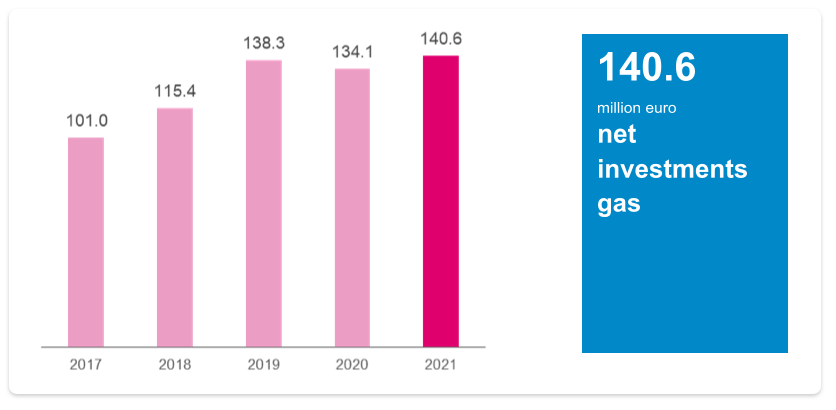
Net investments in the gas area amounted to 140.6 million euro in 2021, up 6.5 million euro compared to the previous year. In gas distribution, the overall increase came to 4.0 million euro, mainly due to non-recurring maintenance on networks and plants, which was up compared to the previous year, even considering the lower effect of the large-scale meter replacement pursuant to Resolution 554/15, relating to the commissioning of smart gas meters. In gas sales, investments coming to 10.2 million euro were recorded for activities related to the acquisition of new customers, up by 1.2 million euro compared to the previous year. Investments increased by 0.8 million euro overall in district heating and heat management services, including an increase in district heating by Hera Spa and a decrease in energy services in the activities of the companies Hera Servizi Energia Srl and AcegasApsAmga Servizi Energetici Spa. On the whole, requests for new connections were slightly down compared to the previous year.
Details of operating investments in the gas area are as follows:
|
Gas (mn€) |
Dec 21 |
Dec 20 |
Abs. change |
% change |
|---|---|---|---|---|
|
Networks and plants |
103.9 |
99.9 |
4.0 |
+4.0% |
|
Acquisition gas customers |
10.2 |
9.0 |
1.2 |
+13.3% |
|
DH/heat management |
27.1 |
26.3 |
0.8 |
+3.0% |
|
Total gas gross |
141.3 |
135.3 |
6.0 |
+4.4% |
|
Capital grants |
0.7 |
1.2 |
(0.5) |
(41.7)% |
|
Total gas net |
140.6 |
134.1 |
6.5 |
+4.8% |
The Regulatory asset base (RAB) for assets owned, which defines the value of the assets recognised by the Authority as regards return on invested capital, increased compared to 2020.
RAB
(bn/€)
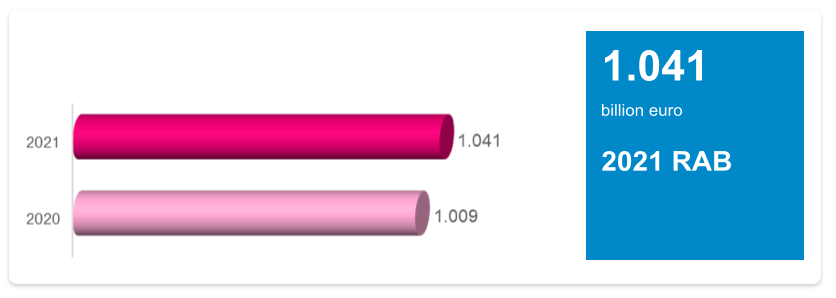
Electricity
At the end of 2021, Ebitda for the electricity area showed a decrease compared to the previous year. The reasons for this drop involve the safeguarded market, due to a different scope of operations, and lower electricity generation activity, particularly in the dispatching services market, which recorded excellent performance the previous year during the period of closures due to the Covid-19 pandemic.
In the safeguarded market, the Hera Group will manage the lot of customers in Campania, Abruzzo and Umbria in 2021, compared to seven lots in the previous two years.
Also note the positive result coming from commercial development in free market customers, supported by innovative offers, value-added services and an increasing improvement in customer experience for each type of customer. In addition to this, Hera Comm Spa was awarded through a tender, for the period from 1 July 2021 to 30 June 2024, the gradual protection service for the supply of electricity to SMEs in nine Italian regions: Campania, Marche, Umbria, Abruzzo, Molise, Basilicata, Calabria, Sicily and Sardinia, corresponding to three lots allocated in the national tender called by the Single Purchaser.
EBITDA ELECTRICITY AREA 2021
|
EBITDA ELECTRICITY AREA 2020
|
The following table shows the changes occurred in terms of Ebitda:
|
(mn€) |
Dec 21 |
Dec 20 |
Abs. change |
% change |
|---|---|---|---|---|
|
Area Ebitda |
144.7 |
188.2 |
(43.5) |
(23.1)% |
|
Group Ebitda |
1,223.9 |
1,123.0 |
100.9 |
9.0% |
|
Percentage weight |
11.8% |
16.8% |
(5.0) pp |
|
CUSTOMERS
(k)
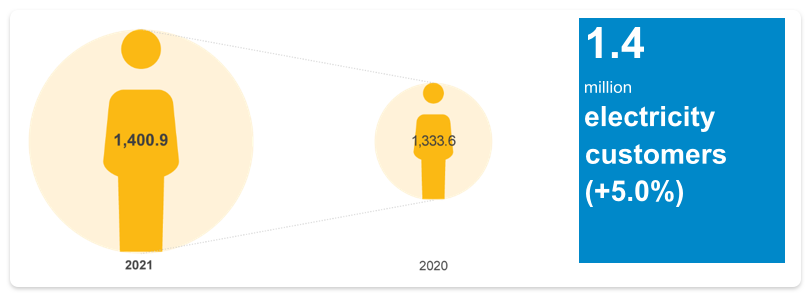
The number of electricity customers increased by 5.0% (up 67.3 thousand) compared to 2020. This growth occurred on the free market, accounting for 9.5% of the total, due to both the reinforced commercial action implemented, resulting in approximately 60 thousand customers, and the award of the Gradual Protection Service, concerning roughly 51 thousand customers. This increase was able to offset the decrease in both 17 thousand greater protection customers and 27 thousand safeguarded customers, due to the different scope of the lots managed.
Alongside the above-mentioned trend, there was an increase in the number of customers subscribing to value-added services, with around 80 thousand customers requesting these services, an increase of 30% compared to the previous year, demonstrating the increasing loyalty of the customer base.
VOLUMES SOLD
(GWh)
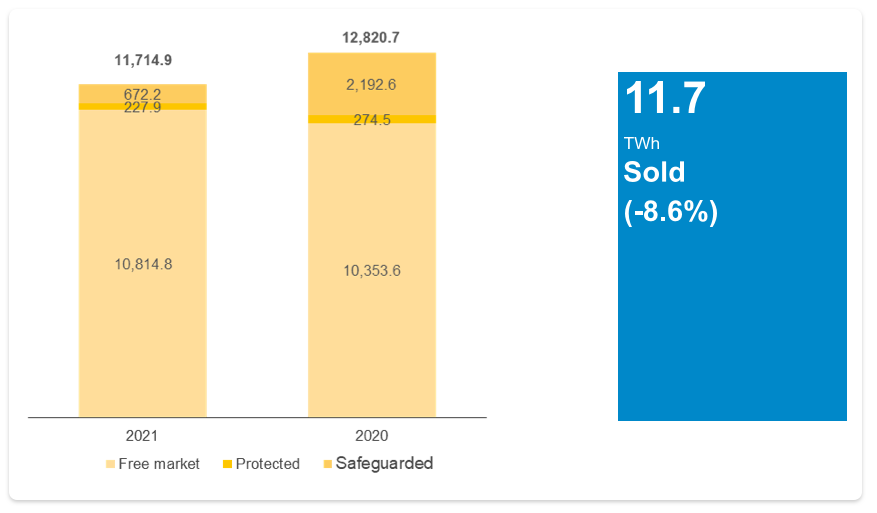
Volumes of electricity sold decreased by 1,105.8 GWh, or 8.6%, compared to 2020. This trend was mainly due to the decrease in volumes in the safeguarded segment, amounting to 1,520.4 GWh, or 11.9% of the total, due to the different scope served, while on traditional markets there was a 414.6 GWh increase, equivalent to 3.3% of the total, thanks to the new gradual protection service mentioned above.
The following table summarises operating results for the electricity area:
|
Income statement (mn€) |
Dec 21 |
% inc. |
Dec 20 |
% inc. |
Abs. change |
% change |
|---|---|---|---|---|---|---|
|
Revenues |
3,024.6 |
|
2,315.9 |
|
708.7 |
30.6% |
|
Operating costs |
(2,846.8) |
(94.1)% |
(2,090.3) |
(90.3)% |
756.5 |
36.2% |
|
Personnel costs |
(47.0) |
(1.6)% |
(48.7) |
(2.1)% |
(1.7) |
(3.5)% |
|
Capitalised costs |
13.8 |
0.5% |
11.3 |
0.5% |
2.5 |
22.2% |
|
Ebitda |
144.7 |
4.8% |
188.2 |
8.1% |
(43.5) |
(23.1)% |
REVENUES
(mn/€)
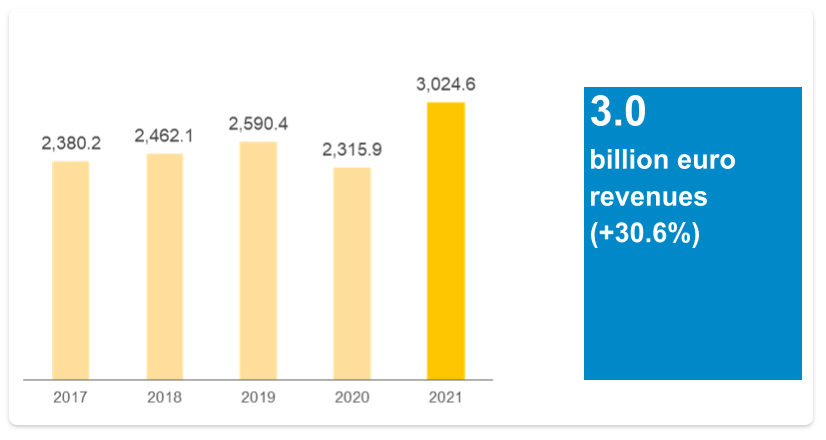
Revenues increased by 708.7 million euro, or 30.6%, compared to 2020. This performance is mainly due to higher revenues from brokerage coming to 243 million euro, higher raw material prices amounting to roughly 679 million euro, higher revenues from generation totalling around 116 million euro and higher revenues from value-added services for customers coming to roughly 15 million euro. Revenues from the electricity business were affected by an increase in the average annual value of the PUN, which was up by 222% compared to the previous year.
The aforementioned increases were only partially offset by a decrease in volumes sold, which led to lower revenues coming to roughly 90 million euro, and lower revenues from off-grid transmission and system charges, totalling 252 million euro, with an equal effect on costs.
Regulated revenues increased by 2 million euro compared with 2020, due to the capex-related tariff increase.
The increase in revenue was reflected more than proportionally by operating costs, which rose by 756.5 million euro. This trend was due to the sharp increase in raw material prices, which had an impact on sales, brokerage and generation, despite the lower volumes sold and lower costs for purchasing energy efficiency certificates.
EBITDA
(mn/€)
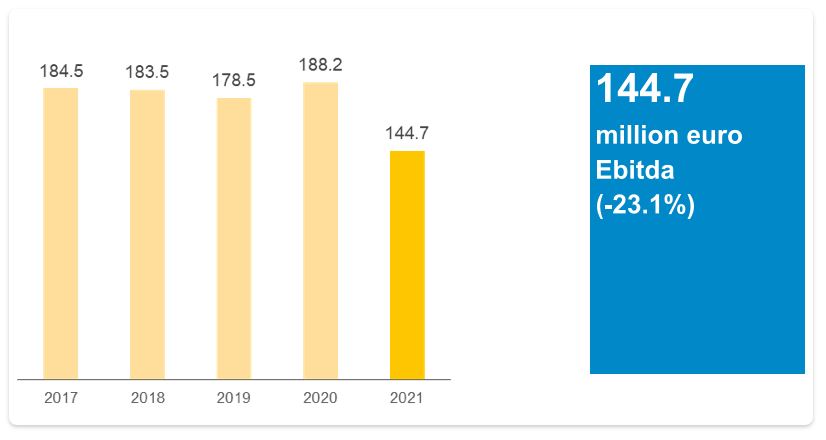
Ebitda decreased by 43.5 million euro, or 23.1%, mainly due to the reduction in the scope of areas served in the safeguard market, amounting to 29 million euro, and lower calls for dispatching services market, coming to around 15 million euro, as mentioned above. Free market activities increased, as did new value-added services, optimisation of plant production and distribution services, which offset the lower margins on brokerage.
In the electricity area, 2021 investments amounted to 55.3 million euro, up 7.6 million euro compared with the previous year.
The interventions carried out mainly concerned non-recurring maintenance on distribution plants and networks in the Modena, Imola, Trieste and Gorizia areas.
Compared to the previous year, a 4.7 million euro increase was seen in electricity distribution for some new constructions, such as the primary cabin in Modena Est, as well as extraordinary maintenance of networks and plants and meter replacement activities, while 2.8 million euro was recorded in energy sales, for activities linked to acquiring new customers. Requests for new connections were also up compared to the previous year.
NET INVESTMENTS ELECTRICITY
(mn/€)
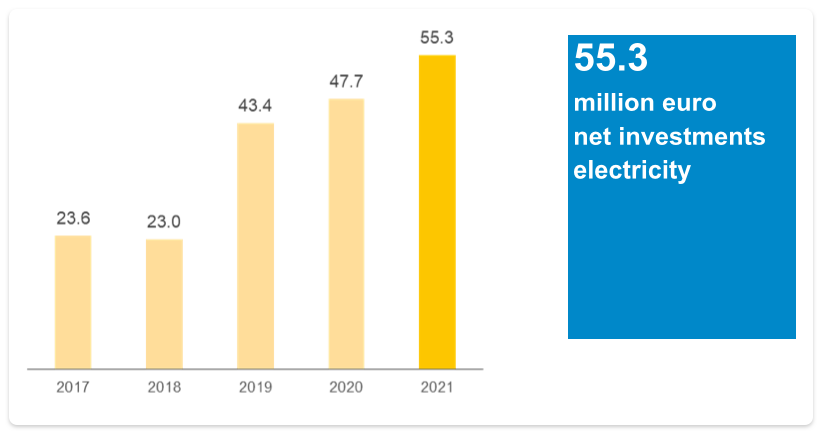
Operating investments in the electricity area were as follows:
|
Electricity (mn€) |
Dec 21 |
Dec 20 |
Abs. change |
% change |
|---|---|---|---|---|
|
Networks and plants |
36.1 |
31.4 |
4.7 |
+15.0% |
|
Acquisition electricity customers |
19.2 |
16.4 |
2.8 |
+17.1% |
|
Total electricity gross |
55.3 |
47.7 |
7.6 |
+15.9% |
|
Capital grants |
‐ |
‐ |
‐ |
+0.0% |
|
Total electricity net |
55.3 |
47.7 |
7.6 |
+15.9% |
RAB, which defines the value of the assets recognised by the Authority as regards return on invested capital, increased compared to 2020.
RAB
(bn/€)
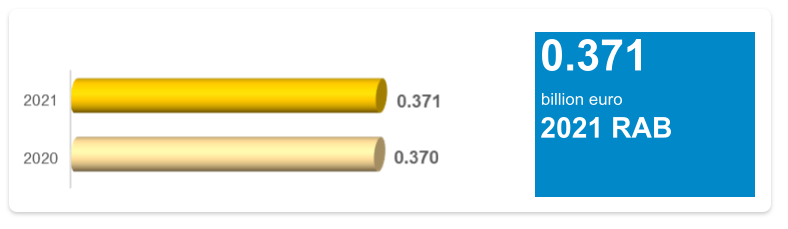
Integrated water cycle
In 2021, the integrated water cycle area showed a slight decrease in results compared to the previous year, with Ebitda falling by 1.3%. As regards regulations, note that 2021 was the second year in which the tariff method defined by the Authority for the third regulatory period (Mti-3), 2020-2023 (resolution 580/2019), was applied. A revenue (VRG) is assigned to each operator, defined on the basis of operating costs and capital costs, according to the investments made, with a view to increasing efficiency in costs, in addition to measures intended to promote and valorise interventions for sustainability and resilience.
In late 2021, ATERSIR definitively awarded Hera the tender for the integrated water service in the Province of Rimini, excluding the Municipality of Maiolo. The new agreement, signed on 23/12/2021, regulates the new concessionary relationship from 01/01/2022 until its scheduled expiry on 31/12/2039. Thanks to the award of this tender, one of the first in Italy, the new water service in the Rimini area will be based on sustainability and innovation, and the Hera Group, also the outgoing manager for the 24 municipalities, will be responsible for the service for the next 18 years.
EBITDA WATER CYCLE 2021
|
EBITDA WATER CYCLE 2020
|
The following table shows the changes occurred in terms of Ebitda:
|
(mn€) |
Dec 21 |
Dec 20 |
Abs. change |
% change |
|---|---|---|---|---|
|
Area Ebitda |
262.4 |
265.8 |
(3.4) |
(1.3)% |
|
Group Ebitda |
1,223.9 |
1,123.0 |
100.9 |
+9.0% |
|
Percentage weight |
21.4% |
23.7% |
(2.3) pp |
|
CUSTOMERS
(k)
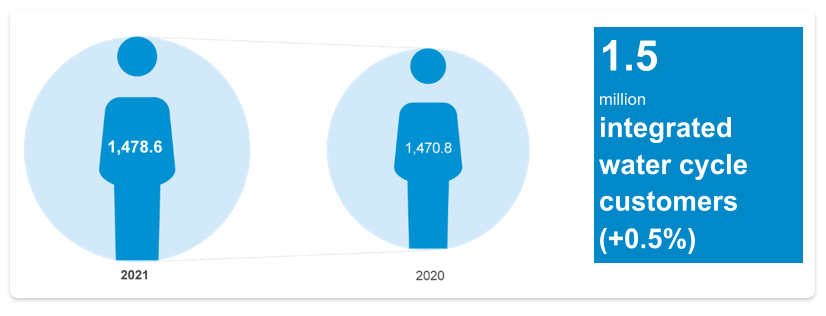
The number of water customers increased by 7.8 thousand, or 0.5%, compared to the previous year, confirming the moderate trend of internal growth in the Group’s reference areas. The Emilia-Romagna area managed by Hera Spa accounted for 72.3% of this growth, while the area served by AcegasApsAmga Spa accounted for 14.3% and the remainder involved the area served by the Marche Multiservizi Spa Group.
The main indicators for the area are as follows:
|
QUANTITY MANAGED 2021
|
QUANTITY MANAGED 2020
|
The volumes supplied through the aqueduct, which amounted to 291.5 million m3, increased by 2.0% compared to December 2020, or 5.7 million m3. In December 2021, the quantities managed relating to sewerage amounted to 238.6 million m3, with a slight decrease coming to 0.9% compared to the previous year, while purification volumes amounted to 234.9 million m3, down 0.7% compared to 2020. The volumes supplied, following the Authority’s resolution 580/2019, are an indicator of the activity of the areas in which the Group operates and are subject to equalisation, owing to legislation that provides for a regulated revenue, recognised independently from volumes distributed.
ELECTRICITY CONSUMED
(GWh)
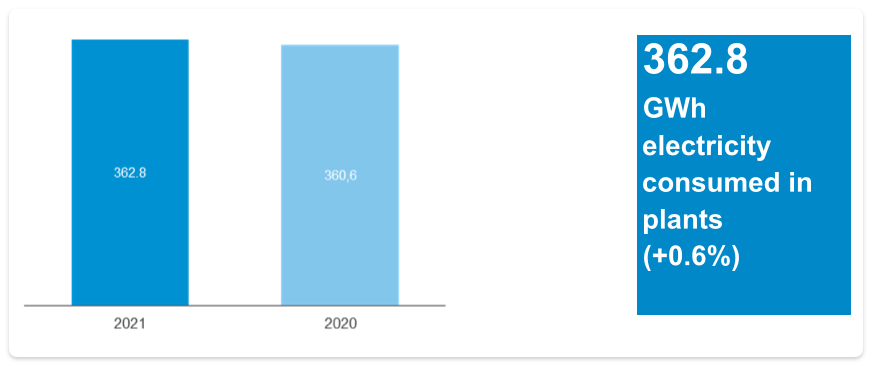
Electricity consumed in plants increased by 2.2 GWh. This increase is mainly linked to the higher volumes supplied in 2021, as described above.
An overview of operating results for the water area is provided in the table below:
|
Income statement (mn€) |
Dec 21 |
% inc. |
Dec 20 |
% inc. |
Abs. change |
% change |
|---|---|---|---|---|---|---|
|
Revenues |
964.7 |
|
883.6 |
|
81.1 |
+9.2% |
|
Operating costs |
(521.3) |
(54.0)% |
(439.8) |
(49.8)% |
81.5 |
+18.5% |
|
Personnel costs |
(185.9) |
(19.3)% |
(183.7) |
(20.8)% |
2.2 |
+1.2% |
|
Capitalised costs |
4.9 |
0.5% |
5.8 |
0.7% |
(0.9) |
(15.6)% |
|
Ebitda |
262.4 |
27.2% |
265.8 |
30.1% |
(3.4) |
(1.3)% |
REVENUES
(mn/€)
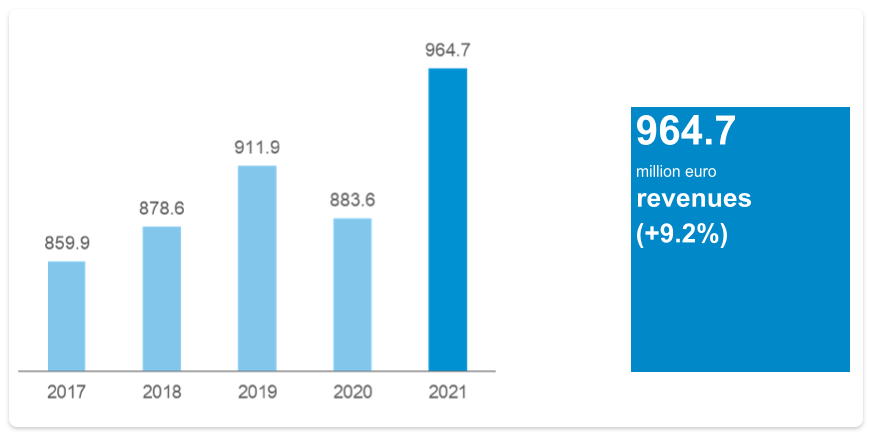
Higher revenue from contracts and works on behalf of third parties carried out in 2021 accounted for 42.0 million euro of this growth in revenues. Revenues from supply showed an increase coming to 33.1 million euro, mainly due to a rise in the equalisation costs for electricity and the raw material water, and the tariff adjustment of the new MTI-3 method. Lastly, the increase in new connection revenues came to 3.0 million euro.
The increase in operating costs in 2021 was mainly due to the higher costs related to the works described above relating to revenues, amounting to 42.0 million euro overall, in addition to higher costs for raw materials including water and electricity, coming to approximately 32.5 million euro. Lastly, higher operating costs were seen for managing networks and plants, the latter related to the different state of progress of works compared to December 2020 due to the Covid-19 pandemic.
EBITDA
(mn/€)
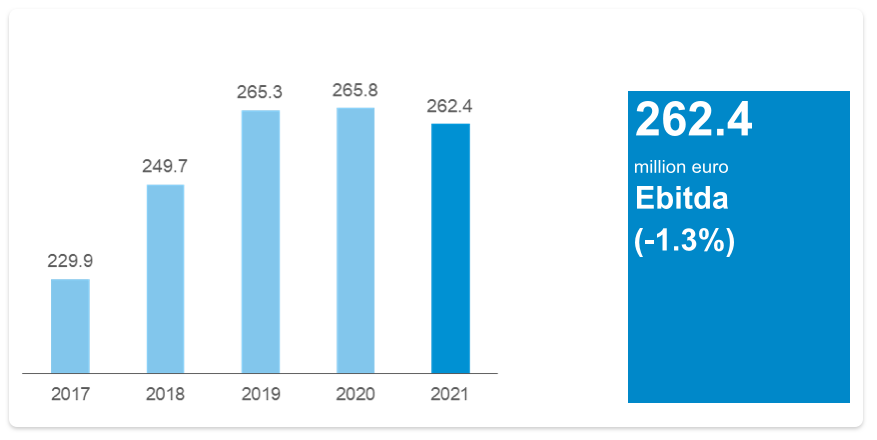
Ebitda decreased by 1.3%. Higher revenues for new connections only partially offset the increase in operating costs for networks and plants, due to the different state of progress of works compared to December 2020.
In 2021, net investments in the integrated water cycle area amounted to 169.0 million euro, up 25.7 million euro compared to the previous year. Including the capital grants received, investments totalled 194.6 million euro, up 28.4 million euro.
These investments mainly involved extensions, reclamations and improvements to networks and plants, as well as regulatory upgrading, especially in the water and sewerage area.
Investments amounted to 113.5 million euro in the aqueduct, 45.0 million euro in sewerage and 36.1 million euro in purification.
NET INVESTMENTS WATER CYCLE
(mn/€)
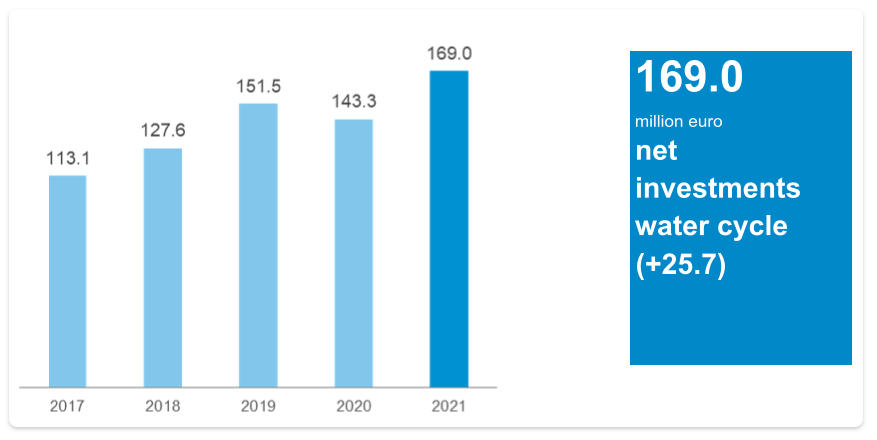
The main interventions included, in the aqueduct, ongoing increases in reclamation activities on networks and connections, linked to Arera resolution 917/2017 on the regulation of the technical quality of the integrated water service; earthquake adaptation and requalification of the hanging tank areas; significant maintenance on the intake works at the Setta stream, serving the Sasso Marconi drinking water plant; reclamation works on the adduction network in the Municipality of Bentivoglio, as well as upgrading water networks in other served areas. In the sewerage sector, progress continues to be made on the Rimini seawater protection plan, with new sewerage separation areas in the northern area, even though Hera’s 2021 interventions are expected to have a lower impact than in the previous year. Maintenance work to upgrade the sewerage network in other areas also continued, as did works to adapt drains to Dgr 201/2016, a type of work that increased in 2021. In purification, note the upgrades to the Lido di Classe purification plant, as well as revamping on the sand collectors at the IDAR purification plant in Bologna and the Gramicia purification plant in Ferrara.
Requests for new water and sewerage connections increased compared to the previous year, partially driven by the economic recovery, predominantly in the construction sector.
Capital grants, amounting to 25.6 million euro, included 16.8 million euro linked to the tariff component of the method for the New Investment Fund (FoNI), and were up by 2.7 million euro compared to the previous year.
Details of operating investments in the integrated water cycle area are as follows:
|
Integrated water cycle (mn€) |
Dec 21 |
Dec 20 |
Abs. change |
% change |
|---|---|---|---|---|
|
Aqueduct |
113.5 |
98.8 |
14.7 |
+14.9% |
|
Purification |
36.1 |
28.2 |
7.9 |
+28.0% |
|
Sewerage |
45.0 |
39.1 |
5.9 |
+15.1% |
|
Total integrated water cycle gross |
194.6 |
166.2 |
28.4 |
+17.1% |
|
Capital grants |
25.6 |
22.9 |
2.7 |
+11.8% |
|
of which FoNI (New Investments Fund) |
16.8 |
13.6 |
3.2 |
+23.5% |
|
Total integrated water cycle net |
169.0 |
143.3 |
25.7 |
+17.9% |
RAB, which defines the value of the assets recognised by the Authority as regards return on invested capital, increased compared to 2020.
RAB
(bn/€)
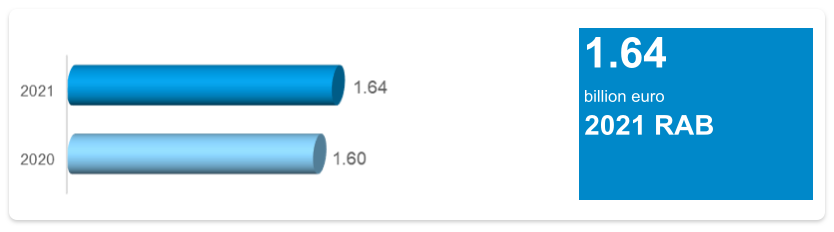
Waste management
In 2021, the waste management area accounted for 23.8% of the Hera Group’s overall Ebitda, with this area’s Ebitda up by 33.7 million euro compared to 2020. Recovery occurred in industrial and waste production in Italy in 2021, albeit far from pre-pandemic amounts, as did a general increase in competition. In this context, the Group proved able to seize opportunities for growth, partially thanks to its set of plants, which continues to be a strategic and distinctive asset on the market. In particular, note the commercial growth of Aliplast Spa and the Group’s expansion in the industrial waste and environmental remediation and restoration market, due to various partnerships and company acquisitions that enabled it to consolidate its leadership. In the fourth quarter, the continuation of the pandemic and the onset of high energy prices caused a temporary slowdown in the activities of some economic sectors, with repercussions on the markets in which the Group is active.
Note that in late 2021, Atersir definitively awarded the tenders for managing urban and assimilated waste in the Modena and Bologna areas temporary associations of companies led by the Hera Group, for the next 15 years.
Thanks to the outstanding operational skills possessed by the Group and the other companies in the winning consortium, the areas covered by the service contracts will be equipped with collection models featuring innovative services and equipment, with a strong focus on sustainability, waste reduction and an increase in recycled materials.
EBITDA WASTE MANAGEMENT AREA 2021
|
EBITDA WASTE MANAGEMENT AREA 2020
|
The following table shows the changes occurred in terms of Ebitda:
|
(mn€) |
Dec 21 |
Dec 20 |
Abs. change |
% change |
|---|---|---|---|---|
|
Area Ebitda |
291.7 |
258.0 |
33.7 |
+13.1% |
|
Group Ebitda |
1,223.9 |
1,123.0 |
100.9 |
+9.0% |
|
Percentage weight |
23.8% |
23.0% |
+0.8 p.p. |
|
Volumes marketed and treated by the Group in 20201are as follows:
|
Quantity (k tons) |
Dec 21 |
Dec 20 |
Abs. change |
% change |
|---|---|---|---|---|
|
Municipal waste |
2,241.8 |
2,219.1 |
22.7 |
+1.0% |
|
Market waste |
2,334.3 |
2,187.6 |
146.7 |
+6.7% |
|
Waste commercialised |
4,576.1 |
4,406.7 |
169.4 |
+3.8% |
|
Plant by-products |
2,200.5 |
2,203.2 |
(2.7) |
(0.1)% |
|
Waste treated by type |
6,776.7 |
6,609.9 |
166.8 |
+2.5% |
An analysis of this data shows a rise in waste commercialised, due to increases in both municipal waste and market waste. As regards municipal waste, 2021 saw growth coming to 1.0% compared to the previous year.
Market volumes increased compared to 2020 by 6.7%, due to the consolidation of previously existing commercial relations and growth in the customer portfolio.
Lastly, plant by-products remained similar to the previous year, mainly due to lower rainfall, offset by higher volumes following acquisitions.
SORTED WASTE
(%)
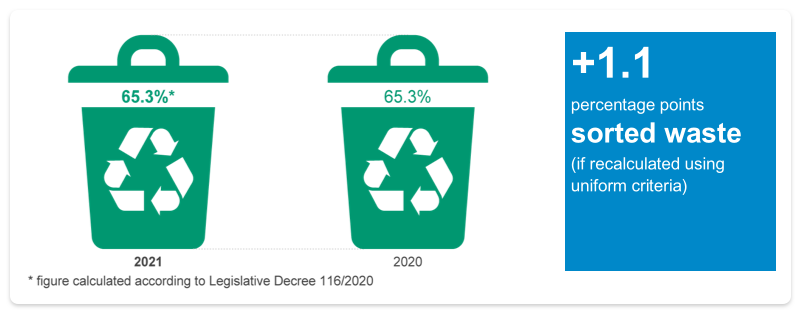
Sorted municipal waste collection was in line with the previous year, but if recalculated using uniform criteria, growth came to +1.1 percentage points. As of July 2021, in fact, Legislative Decree 116/2020 was applied, which excludes construction and demolition waste from the percentage calculation of sorted waste collection.
The Hera Group operates in the entire waste cycle, with 97 plants for treating municipal and special waste and regenerating plastic materials. This number increased by seven compared to 2020, thanks to new corporate acquisitions. The main plants include: nine waste-to-energy plants, 12 composting/digestion plants and 15 selecting plants.
The close attention paid to the set of plants has always been a distinctive element of the Group’s propensity for excellence: operations are indeed ongoing to further improve safety and align plants with the best available technologies.
WASTE TREATED BY TYPE OF PLANT 2021
|
WASTE TREATED BY TYPE OF PLANT 2020
|
|
Quantity (k tons) |
Dec 21 |
Dec 20 |
Abs. change |
% change |
|---|---|---|---|---|
|
Landfills |
636.4 |
677.4 |
(41.0) |
(6.1)% |
|
WTE |
1,205.2 |
1,275.4 |
(70.2) |
(5.5)% |
|
Selecting plants and other |
550.8 |
530.7 |
20.1 |
+3.8% |
|
Composting and stabilisation plants |
498.1 |
509.4 |
(11.3) |
(2.2)% |
|
Inertisation and chemical-physical plants |
1,322.4 |
1,208.4 |
114.0 |
+9.4% |
|
Other plants |
2,563.8 |
2,408.7 |
155.1 |
+6.4% |
|
Waste treated by plant |
6,776.7 |
6,609.9 |
166.8 |
+2.5% |
|
|
|
|
|
|
|
Plastic recycled by Aliplast Spa |
80.9 |
68.8 |
12.1 |
+17.6% |
Waste treatment showed an overall growth coming to 2.5% compared to December 2020, partially due to the increase in the number of plants managed. Analysing the individual sectors, a decrease was seen in the quantity disposed of in landfills, mainly due to the exhaustion of the Sommacampagna and Ravenna plants. As regards waste-to-energy plants, the decrease was mainly due to revamping on the Trieste plant and the shutdown for scheduled maintenance at the Modena waste-to-energy plant. The increased quantity in sorting plants was due to the greater quantities treated in all plants, thanks to the rise in sorted waste collection. In composting and stabilisation plants, volumes decreased slightly, while in inertisation and chemical-physical plants, the increased quantity was mainly due to the higher volumes at the purification plants in Tuscany, at the Pozzilli plant, which was not operating in early 2020, and increased volumes for new acquisitions. Lastly, note the increase in the other plants sector.
The table below summarises the area’s operating results:
|
Income statement (mn€) |
Dec 21 |
% inc. |
Dec 20 |
% inc. |
Abs. change |
% change |
|---|---|---|---|---|---|---|
|
Revenues |
1,328.4 |
|
1,190.3 |
|
138.1 |
+11.6% |
|
Operating costs |
(846.5) |
(63.7)% |
(740.2) |
(62.2)% |
106.3 |
+14.4% |
|
Personnel costs |
(211.8) |
(15.9)% |
(203.6) |
(17.1)% |
8.2 |
+4.0% |
|
Capitalised costs |
21.7 |
1.6% |
11.4 |
1.0% |
10.3 |
+90.4% |
|
Ebitda |
291.7 |
22.0% |
258.0 |
21.7% |
33.7 |
+13.1% |
REVENUES
(mn/€)
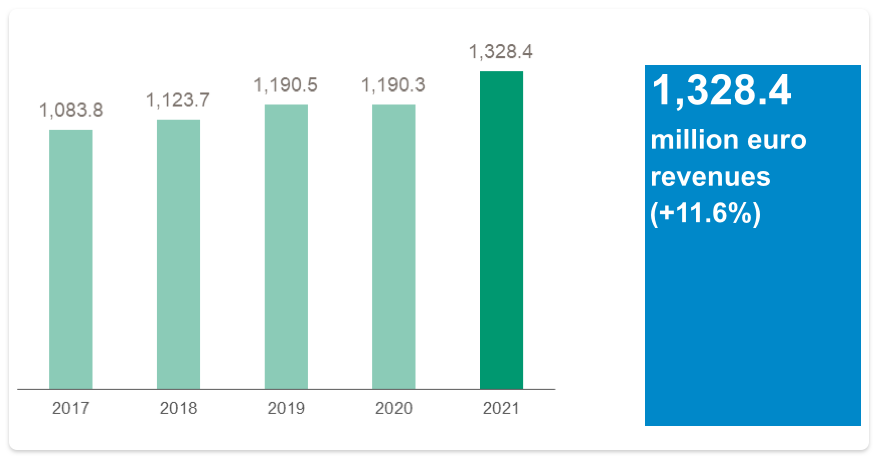
Revenues increased by 11.6% compared to the previous year. Revenues from energy production were up by 20.3 million euro, mainly due to the increase in the prices of GRIN certificates, as well as market and thermal energy and biomethane production prices, despite a 70.2 thousand ton reduction in volumes in WTEs. A higher contribution also came from Aliplast Spa, up +55.2 million euro compared to 2020, or +53%, as a result of the increase in prices and higher products sold, mainly Film PE and Granulo PET.
Also note the 37 million euro increase in revenues related to new acquisitions in the industry market, and the higher value of materials due to an increase in prices, especially concerning paper, glass and iron.
Operating costs for 2021 grew by 14.4%. In the treatment market, an increase occurred in costs for purchasing raw materials, new acquisitions and scheduled maintenance on Group plants. This rise was offset by efficiencies in operating costs. In the recovery market, there is an increase was seen in the purchasing costs for raw materials sustained by Aliplast Spa, related to the trend in revenues mentioned above. As far as municipal waste collection is concerned, the increased activities were related to developing new sorted waste collection projects.
EBITDA
(mn/€)
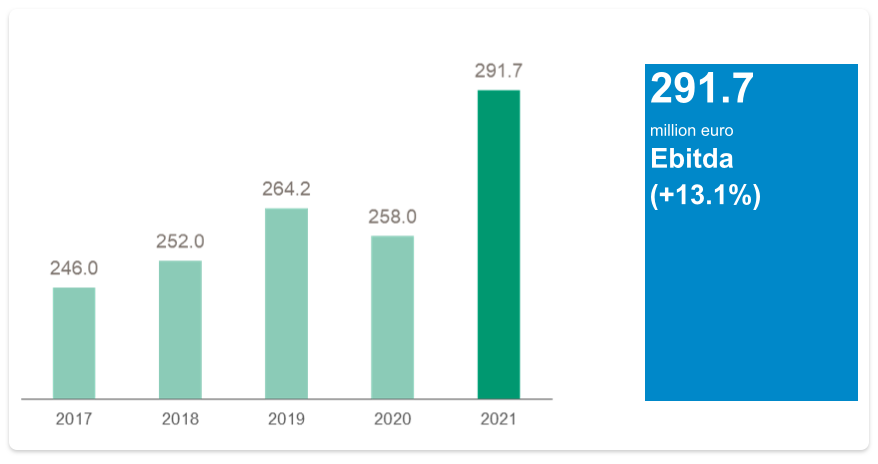
The rise in Ebitda was mainly due to increased activities in plastics recovery, coming to 20.7 million euro, expansion in the industrial waste market with new acquisitions, accounting for approximately 9 million euro, and an increase in waste income due to higher prices. These positive factors were only partly offset by higher raw material purchasing prices and higher maintenance costs for Group plants.
Net investments in the waste management area were related to maintenance and upgrading on waste treatment plants and amounted to 96.5 million euro, up 28.9 million euro compared to the previous year.
The composting/digester plants sector showed an increase of 2.8 million euro, mainly due to the start of work on NewCo Biorg Srl, partially offset by lower work on the plants in Voltana, Sant’Agata, Rimini and Cesena, which underwent major work during the previous year. In the same sector, the activities of Green Factory Srl in the Marche region are also worth mentioning.
Investments in landfills decreased by 2.5 million euro, due to work carried out during the previous year on the 5th lot of the Pago plant.
The WTE sector showed a 10.6 million euro increase, mainly due revamping on line two of the Trieste plant, as well as non-recurring maintenance carried out at the Modena plant.
Investments in the industrial waste plants sector increased by 10.7 million euro compared to the previous year, and were mainly related to revamping on the F3 plant in Ravenna.
Investments in the collection area and equipment sector increased by 2.2 million euro compared to the previous year and included the work carried out on underground collection areas. The 6.1 million euro increase seen in the sorting and recovery plants sector was due to higher investments for the work on the new PE regenerator belonging to Aliplast Spa, as well as the change in the scope of operations of the companies Recycla Spa and Vallortigara Group.
NET INVESTMENTS WASTE MANAGEMENT
(mn/€)
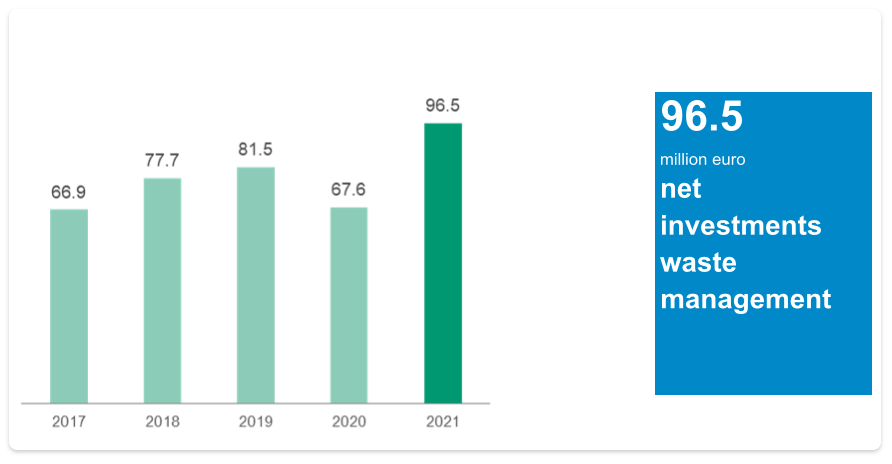
Details of operating investments in the waste management area are as follows:
|
Waste management (mn€) |
Dec 21 |
Dec 20 |
Abs. change |
% change |
|---|---|---|---|---|
|
Composters/digesters |
7.5 |
4.7 |
2.8 |
+59.6% |
|
Landfills |
8.3 |
10.8 |
(2.5) |
(23.1)% |
|
WTE |
24.6 |
14.0 |
10.6 |
+75.7% |
|
RS plants |
17.3 |
6.6 |
10.7 |
+162.1% |
|
Collection areas and equipment |
16.6 |
14.4 |
2.2 |
+15.3% |
|
Transshipment, selecting and other plants |
24.0 |
17.9 |
6.1 |
+34.1% |
|
Total waste management gross |
98.2 |
68.3 |
29.9 |
+43.8% |
|
Capital grants |
1.7 |
0.7 |
1.0 |
+142.9% |
|
Total waste management net |
96.5 |
67.6 |
28.9 |
+42.8% |
Other services
The other services area covers all minor businesses managed by the Group, including public lighting, in which the Hera Group’s efforts go towards planning, constructing and maintaining lighting structures, contributing to safety across the areas served through avant-garde technologies and constant attention towards the circular economy and sustainability; telecommunications, in which the Group offers connectivity for private customers and companies, telephone and Data Centre services through its own digital company; and, lastly, cemetery services. In 2021, results in this area stood at 37.4 million euro, up 0.7 million euro over the previous year.
OTHER SERVICES EBITDA 2021
|
OTHER SERVICES EBITDA 2020
|
The changes occurred in terms of Ebitda are as follows:
|
(mn€) |
Dec 21 |
Dec 20 |
Abs. change |
% change |
|---|---|---|---|---|
|
Area Ebitda |
37.4 |
36.7 |
0.7 |
+1.9% |
|
Group Ebitda |
1,223.9 |
1,123.0 |
100.9 |
+9.0% |
|
Percentage weight |
3.1% |
3.3% |
(0.2) pp |
|
The following table shows the area’s main indicators as regards public lighting services:
|
Quantity |
Dec 21 |
Dec 20 |
Abs. change |
% change |
|---|---|---|---|---|
|
Public lighting |
|
|
|
|
|
Lighting points (k) |
563.2 |
571.3 |
(8.1) |
(1.4)% |
|
of which LED |
35.2% |
35.1% |
+0.1 |
+0.0% |
|
Municipalities served |
184.0 |
188.0 |
(4.0) |
(2.1)% |
In 2021, the Hera Group acquired approximately 13.7 thousand lighting points in 10 new municipalities. The most significant acquisitions were: approximately 8.9 thousand lighting points in Lombardy, approximately 2.3 thousand lighting points in Lazio, approximately 1.5 thousand lighting points in Sardinia and other regions of central Italy, and one thousand lighting points in Friuli-Venezia Giulia. The year’s increases only partially offset the loss of about 21.8 thousand lighting points and 14 municipalities, mainly in Friuli-Venezia Giulia and Veneto.
The percentage of lighting points that use LED bulbs stands at 35.2%, and provides evidence of the Group’s constant focus on an increasingly efficient and sustainable management of public lighting.
Quantitative indicators in the other services area also include the 4,440 km of proprietary ultra-wideband fibre optic network that the Hera Group owns through its digital company, Acantho Spa. This network serves the main cities in Emilia-Romagna, along with Padua and Trieste, and provides companies and individuals with high-performance connectivity, high reliability and maximum security for systems, data and service continuity.
The area’s operating results are provided in the table below:
|
Income statement (mn€) |
Dec 21 |
% inc. |
Dec 20 |
% inc. |
Abs. change |
% change |
|---|---|---|---|---|---|---|
|
Revenues |
170.8 |
|
147.1 |
|
23.7 |
+16.1% |
|
Operating costs |
(114.1) |
(66.8)% |
(92.0) |
(62.5)% |
22.1 |
+24.0% |
|
Personnel costs |
(21.2) |
(12.4)% |
(20.3) |
(13.8)% |
0.9 |
+4.4% |
|
Capitalised costs |
1.9 |
1.1% |
1.8 |
1.2% |
0.1 |
+5.5% |
|
Ebitda |
37.4 |
21.9% |
36.7 |
24.9% |
0.7 |
+1.9% |
REVENUES
(mn/€)
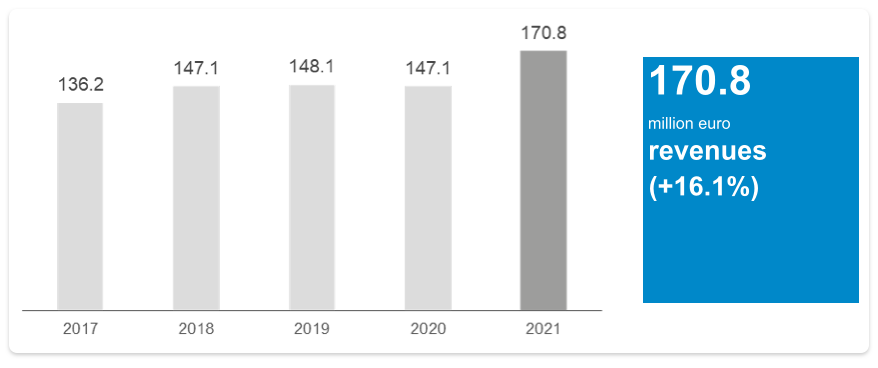
The growth in revenues was mainly due to public lighting, with 50% related to progress on the energy requalification works carried out and 50% to energy adjustments on public lighting fees. The telecommunications business concentrated its main activities on telephone and connectivity services for the Group as well.
The increase in operating costs was related to the trends seen in both public lighting and telecommunications revenues.
EBITDA
(mn/€)
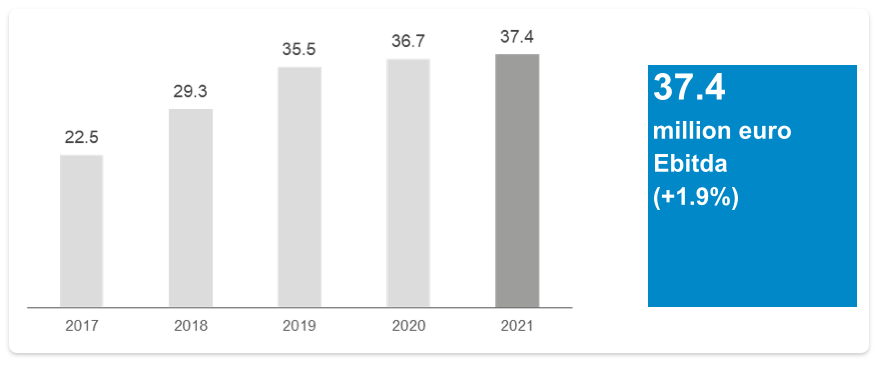
Ebitda for the other services business increased by 1.9% overall, or 0.7 million euro.
Net investments in the other services business amounted to 13.3 million euro, up 2.2 million euro on the previous year.
In telecommunications, 8.6 million euro in investments were made in network and TLC services, up 0.5 million euro compared to the previous year. In public lighting, investments were related to maintenance, upgrading and modernisation for lighting systems in the areas managed and amounted to 5.9 million euro, up 2.9 million euro compared to the previous year, and did not include public lighting contracts subject to different accounting under IFRIC 12.
NET INVESTMENTS OTHER SERVICES
(mn/€)
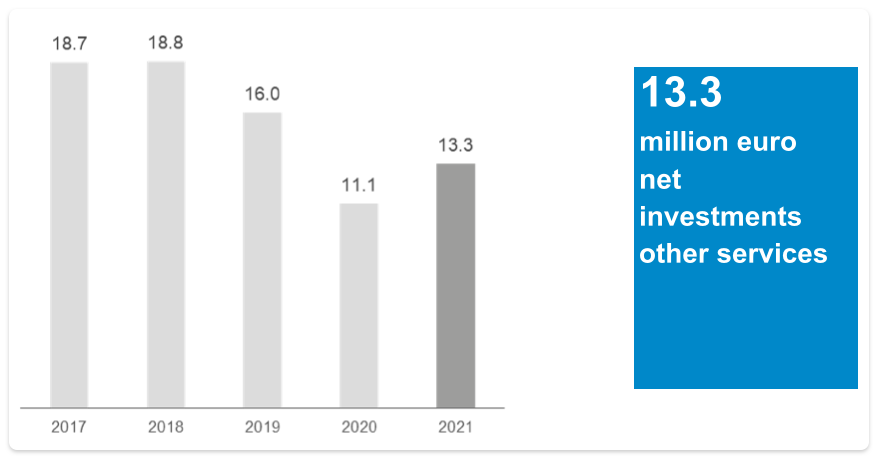
Details of operating investments in the other services area are as follows:
|
Other services (mn€) |
Dec 21 |
Dec 20 |
Abs. change |
% change |
|---|---|---|---|---|
|
TLC |
8.6 |
8.1 |
0.5 |
+6.2% |
|
Public lighting and traffic lights |
5.9 |
3.0 |
2.9 |
+96.7% |
|
Total other services gross |
14.6 |
11.1 |
3.5 |
+31.5% |
|
Capital grants |
1.3 |
‐ |
1.3 |
+100.0% |
|
Total other services net |
13.3 |
11.1 |
2.2 |
+19.8% |
|
mn€ |
notes |
2021 |
2020 |
|---|---|---|---|
|
Revenues |
1 |
10,555.3 |
7,079.0 |
|
Other operating revenues |
2 |
400.1 |
467.8 |
|
Raw and other materials |
3 |
(6,668.5) |
(3,410.6) |
|
Service costs |
4 |
(2,464.6) |
(2,424.9) |
|
Personnel costs |
5 |
(592.8) |
(572.7) |
|
Other operating costs |
6 |
(66.5) |
(58.9) |
|
Capitalised costs |
7 |
60.8 |
43.3 |
|
Amortisation, provisions and depreciation |
8 |
(612.1) |
(571.7) |
|
Operating revenues |
|
611.7 |
551.3 |
|
Share of profits (losses) pertaining to joint ventures and associated companies |
9 |
13.2 |
8.2 |
|
Financial income |
10 |
82.3 |
73.4 |
|
Financial expenses |
10 |
(300.3) |
(198.3) |
|
Financial management |
|
(204.8) |
(116.7) |
|
Pre-tax profit |
|
406.9 |
434.6 |
|
Taxes |
12 |
(34.2) |
(111.8) |
|
Net profit for the period |
|
372.7 |
322.8 |
|
Attributable to: |
|
|
|
|
parent company shareholders |
|
333.5 |
302.7 |
|
minority shareholders |
|
39.2 |
20.1 |
|
Earnings per share |
|
|
|
|
basic |
12 |
0.228 |
0.206 |
|
diluted |
12 |
0.228 |
0.206 |
Pursuant to Consob Resolution no. 15519 of 27 July 2006, the effects of relationships with related parties are accounted for in the appropriate income statement outlined in paragraph 2.04.01 of this consolidated financial statement.
|
mn€ |
notes |
2021 |
2020 |
|---|---|---|---|
|
Net profit (loss) for the period |
|
372.7 |
322.8 |
|
Items reclassifiable to the income statement |
|
|
|
|
Fair value of derivatives, change for the period |
20 |
124.7 |
60.8 |
|
Tax effect related to reclassifiable items |
|
(35.3) |
(17.5) |
|
Items not reclassifiable to the income statement |
|
|
|
|
Actuarial income (losses) employee and post-employment benefits |
27 |
1.6 |
(1.9) |
|
Shareholdings valued at fair value |
17 |
(2.1) |
(3.5) |
|
Tax effect related to not reclassifiable items |
|
(0.2) |
0.4 |
|
Total comprehensive profit (loss) for the period |
|
461.4 |
361.1 |
|
Attributable to: |
|
|
|
|
parent company shareholders |
|
420.5 |
341.7 |
|
minority shareholders |
|
40.9 |
19.4 |
|
mn€ |
notes |
31 Dec 21 |
31 Dec 20 |
|---|---|---|---|
|
ASSETS |
|
|
|
|
Non-current assets |
|
|
|
|
Tangible assets |
13.31 |
1,941.0 |
1,926.5 |
|
Rights of use |
14.31 |
101.6 |
95.9 |
|
Intangible assets |
15.31 |
4,126.7 |
3,924.4 |
|
Goodwill |
16.31 |
842.9 |
812.8 |
|
Shareholdings |
17.31 |
198.5 |
187.9 |
|
Non-current financial assets |
18.35 |
142.7 |
140.8 |
|
Deferred tax assets |
19 |
229.4 |
156.6 |
|
Derivative instruments |
20 |
6.9 |
14.4 |
|
Total non-current assets |
|
7,589.7 |
7,259.3 |
|
Current assets |
|
|
|
|
Inventories |
21 |
368.0 |
171.7 |
|
Trade receivables |
22.35 |
2,918.0 |
1,971.6 |
|
Current financial assets |
18.35 |
29.3 |
32.8 |
|
Current tax assets |
23.35 |
21.2 |
11.7 |
|
Other current assets |
24.35 |
422.3 |
487.5 |
|
Derivative instruments |
20 |
1,797.4 |
113.1 |
|
Cash and cash equivalents |
18 |
885.6 |
987.1 |
|
Total current assets |
|
6,441.8 |
3,775.5 |
|
TOTAL ASSETS |
|
14,031.5 |
11,034.8 |
Pursuant to Consob Resolution no. 15519 of 27 July 2006, the effects of relationships with related parties are accounted for in the appropriate statement of financial position outlined in paragraph 2.04.02 of this consolidated financial statement.
|
mn€ |
notes |
31 Dec 21 |
31 Dec 20 |
|---|---|---|---|
|
NET EQUITY AND LIABILITIES |
|
|
|
|
Share capital and reserves |
|
|
|
|
Share capital |
25 |
1,459.6 |
1,460.0 |
|
Reserves |
25 |
1,407.1 |
1,198.1 |
|
Profit (loss) for the period |
|
333.5 |
302.7 |
|
Group net equity |
|
3,200.2 |
2,960.8 |
|
Non-controlling interests |
25 |
216.6 |
194.5 |
|
Total net equity |
|
3,416.8 |
3,155.3 |
|
Non-current liabilities |
|
|
|
|
Non-current financial liabilities |
26.35 |
3,716.0 |
3,678.7 |
|
Non-current lease liabilities |
14.35 |
53.2 |
73.5 |
|
Post-employment and other benefits |
27 |
105.4 |
116.7 |
|
Provisions for risks and charges |
28 |
528.0 |
538.2 |
|
Deferred tax liabilities |
19 |
132.1 |
120.5 |
|
Derivative instruments |
20 |
13.5 |
20.1 |
|
Total non-current liabilities |
|
4,548.2 |
4,547.7 |
|
Current liabilities |
|
|
|
|
Current financial liabilities |
26.35 |
499.7 |
616.9 |
|
Current lease liabilities |
14.35 |
43.4 |
20.1 |
|
Trade payables |
29.35 |
2,356.6 |
1,497.5 |
|
Current tax liabilities |
23.35 |
27.9 |
25.4 |
|
Other current liabilities |
30.35 |
1,435.6 |
1,056.2 |
|
Derivative instruments |
20 |
1,703.3 |
115.7 |
|
Total current liabilities |
|
6,066.5 |
3,331.8 |
|
TOTAL LIABILITIES |
|
10,614.7 |
7,879.5 |
|
TOTAL NET EQUITY AND LIABILITIES |
|
14,031.5 |
11,034.8 |
Pursuant to Consob Resolution no. 15519 of 27 July 2006, the effects of relationships with related parties are accounted for in the appropriate statement of financial position outlined in paragraph 2.04.02 of this consolidated financial statement.
|
mn€ |
notes |
31 Dec 21 |
31 Dec 20 |
|---|---|---|---|
|
Earnings before taxes |
|
406.9 |
434.6 |
|
Adjustments to reconcile net profit to the cashflow from operating activities |
|
|
|
|
Amortisation and impairment of assets |
8 |
469.9 |
457.1 |
|
Allocation to provisions |
8 |
142.2 |
114.6 |
|
Effects from valuation using the net equity method |
9 |
(13.2) |
(8.2) |
|
Financial (income) expenses |
10 |
218.0 |
124.9 |
|
(Capital gains) losses and other non-monetary elements |
|
25.5 |
(6.7) |
|
Change in provision for risks and charges |
28 |
(31.2) |
(30.2) |
|
Change in provision for employee and post-employment benefits |
27 |
(12.6) |
(13.5) |
|
Total cash flow before changes in net working capital |
|
1,205.5 |
1,072.6 |
|
(Increase) decrease in inventories |
32 |
(196.7) |
(3.8) |
|
(Increase) decrease in trade receivables |
32 |
(893.8) |
4.8 |
|
Increase (decrease) in trade payables |
32 |
858.5 |
101.9 |
|
Increase/decrease in other current assets/liabilities |
32 |
279.8 |
(65.1) |
|
Changes in working capital |
|
47.8 |
37.8 |
|
Dividends collected |
32 |
12.0 |
10.1 |
|
Interest income and other financial income collected |
32 |
32.6 |
37.4 |
|
Interest expenses, net charges on derivatives and other paid financial charges |
32 |
(96.2) |
(81.9) |
|
Taxes paid |
32 |
(156.3) |
(184.6) |
|
Cash flow from operating activities (a) |
|
1,045.4 |
891.4 |
|
Investments in tangible assets |
13 |
(171.9) |
(140.6) |
|
Investments in intangible assets |
15 |
(416.8) |
(365.8) |
|
Investments in subsidiary companies and business units net of cash holdings |
33 |
(64.1) |
(1.8) |
|
Other equity investments |
33 |
(11.0) |
(46.8) |
|
Sale price of tangible and intangible assets |
33 |
2.5 |
3.6 |
|
Divestments of shareholdings and contingent consideration |
33 |
0.2 |
2.0 |
|
(Increase) decrease in other investment activities |
33 |
(1.5) |
30.8 |
|
Cash flow from (for) investing activities (b) |
|
(662.6) |
(518.6) |
|
New issue of long-term binds |
34 |
525.1 |
512.6 |
|
Repayments of non-current financial liabilities |
34 |
(519.8) |
(2.0) |
|
Repayments and other net changes in financial liabilities |
34 |
(252.9) |
(18.9) |
|
Lease payments |
34 |
(22.5) |
(22.1) |
|
Acquisition of interests in consolidated companies |
34 |
(21.0) |
(1.2) |
|
Dividends paid out to Hera shareholders and non-controlling interests |
34 |
(193.0) |
(163.3) |
|
Changes in treasury share |
25 |
(0.2) |
(54.8) |
|
Cash flow from (for) financing activities (c) |
|
(484.3) |
250.3 |
|
Increase (decrease) in cash holdings (a+b+c) |
|
(101.5) |
623.1 |
|
Cash and cash equivalents at the beginning of the year |
18 |
987.1 |
364.0 |
|
Cash and cash equivalents at year end |
18 |
885.6 |
987.1 |
Pursuant to Consob Resolution no. 15519 of 27 July 2006, the effects of relationships with related parties are accounted for in the appropriate cash flow statement outlined in paragraph 2.04.03 of this consolidated financial statement.
|
mn€ |
Share capital |
Reserves |
Reserves derivatives valued at fairvalue |
Reserves actuarial income (losses) employee and post-employment benefits |
Reserves shares valued at fair value |
Profit for the period |
Net equity |
Non-controlling interests |
Total |
|---|---|---|---|---|---|---|---|---|---|
|
Balance at 1 Jan 20 |
1,474.8 |
1,019.7 |
(37.9) |
(33.8) |
‐ |
385.7 |
2.808.5 |
201.5 |
3,010.0 |
|
Profit for the period |
|
|
|
|
|
302.7 |
302.7 |
20.1 |
322.8 |
|
Other components of comprehensive income: |
|
|
|
|
|
|
|
|
|
|
fair value of derivatives, change for the period |
|
|
43.8 |
|
|
|
43.8 |
(0.5) |
43.3 |
|
Actuarial income (losses) employee and post-employment benefits |
|
|
|
(1.3) |
|
|
(1.3) |
(0.2) |
(1.5) |
|
fair value shareholdings, change for the period |
|
|
|
|
(3.5) |
|
(3.5) |
|
(3.5) |
|
Overall profit for the period |
‐ |
‐ |
43.8 |
(1.3) |
(3.5) |
302.7 |
341.7 |
19.4 |
361.1 |
|
change in treasury shares |
(14.8) |
(29.9) |
|
|
|
|
(44.7) |
|
(44.7) |
|
change in equity investments |
|
|
|
|
|
|
‐ |
(11.3) |
(11.3) |
|
other movements |
|
2.4 |
|
|
|
|
2.4 |
0.9 |
3.3 |
|
Allocation of revenues: |
|
|
|
|
|
|
|
|
|
|
dividends paid out |
|
|
|
|
|
(147.1) |
(147.1) |
(16.0) |
(163.1) |
|
allocation to reserves |
|
238.6 |
|
|
|
(238.6) |
‐ |
|
‐ |
|
Balance at 31 Dec 20 |
1,460.0 |
1,230.8 |
5.9 |
(35.1) |
(3.5) |
302.7 |
2,960.8 |
194.5 |
3,155.3 |
|
Balance at 1 Jan 21 |
1,460.0 |
1,230.8 |
5.9 |
(35.1) |
(3.5) |
302.7 |
2,960.8 |
194.5 |
3,155.3 |
|
Profit for the period |
|
|
|
|
|
333.5 |
333.5 |
39.2 |
372.7 |
|
Other components of comprehensive income: |
|
|
|
|
|
|
|
|
|
|
fair value of derivatives, change for the period |
|
|
87.7 |
|
|
|
87.7 |
1.7 |
89.4 |
|
Actuarial income (losses) employee and post-employment benefits |
|
|
|
1.4 |
|
|
1.4 |
|
1.4 |
|
fair value shareholdings, change for the period |
|
|
|
|
(2.1) |
|
(2.1) |
|
(2.1) |
|
Overall profit for the period |
‐ |
‐ |
87.7 |
1.4 |
(2.1) |
333.5 |
420.5 |
40.9 |
461.4 |
|
change in treasury shares |
(0.4) |
0.2 |
|
|
|
|
(0.2) |
|
(0.2) |
|
change in equity investments |
|
(19.8) |
|
|
|
|
(19.8) |
(1.2) |
(21.0) |
|
Allocation of revenues: |
|
|
|
|
|
|
|
|
|
|
dividends paid out |
|
|
|
|
|
(161.1) |
(161.1) |
(17.6) |
(178.7) |
|
allocation to reserves |
|
141.6 |
|
|
|
(141.6) |
‐ |
|
‐ |
|
Balance at 31 Dec 21 |
1,459.6 |
1,352.8 |
93.6 |
(33.7) |
(5.6) |
333.5 |
3,200.2 |
216.6 |
3,416.8 |
|
|
|
31 Dec 21 |
31 Dec 20 |
|---|---|---|---|
|
A |
Cash |
885.6 |
987.1 |
|
B |
Cash equivalents |
‐ |
‐ |
|
C |
Other current financial assets |
29.3 |
32.8 |
|
D |
Liquidity (A+B+C) |
914.9 |
1,019.9 |
|
E |
Current financial debt |
(443.6) |
(302.6) |
|
F |
Current portion of non-current financial debt |
(99.5) |
(327.2) |
|
G |
Current financial indebtedness (E+F) |
(543.1) |
(629.8) |
|
H |
Net current financial indebtedness (G-D) |
371.8 |
390.1 |
|
I |
Non-current financial debt |
(1,073.8) |
(1,203.6) |
|
J |
Debt instruments |
(2,702.0) |
(2,554.3) |
|
K |
Non-current trade and other payables |
‐ |
‐ |
|
L |
Non-current financial indebtedness (I+J+K) |
(3,775.8) |
(3,757.9) |
|
M |
Total financial indebtedness (H+L) |
(3,404.0) |
(3,367.8) |
|
|
Non-current financial receivables |
142.7 |
140.8 |
|
|
Net financial debt (net debt) |
(3,261.3) |
(3,227.0) |
An overview of Hera's performance to allow those interested in investing in Hera to do so with a full awareness of the return expected by this company from its investment plan and a clear idea of the policy adopted in profit distribution. The data presented comes from the Group’s 2021 Financial statements and provides an overview of its various businesses, along with the factors involved in its growth and the Group's sustainable approach, aimed at the creation of shared value.
Hera was founded in 2002 from the merger of 11 multi-utilities operating in Northern Italy.
The company, listed on the Milan Stock Exchange since 2003, has shown a 50% increase in net profits already in its first annual financial report.
These results were achieved thanks to several factors:
The uninterrupted growth brought the Ebitda and the Net Invested Capital to a 6.3x increase and shareholders have always been granted a stable/growing dividend per share.
Today the Group operates in the northern, central and north-eastern area of Italy and presents excellent prospects for further growth, thanks to its ability to meet the constant challenges of the market and exploit its strong competitive advantages.
Our MULTI-UTILITY BUSINESS
EBITDA Y2021
(M€)
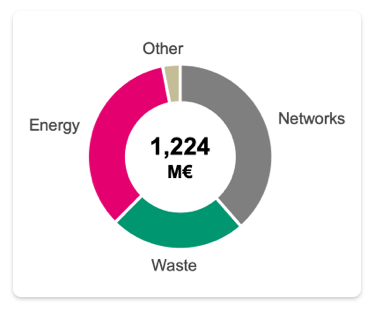
MARKET POSITIONING
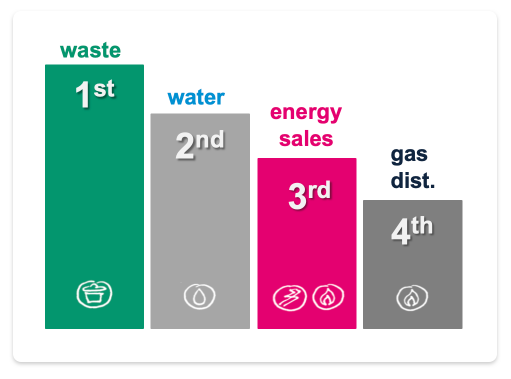
Low risk exposure
Networks
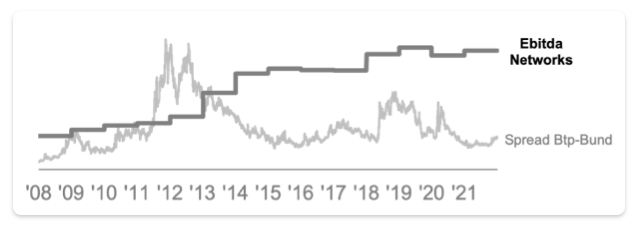
Waste
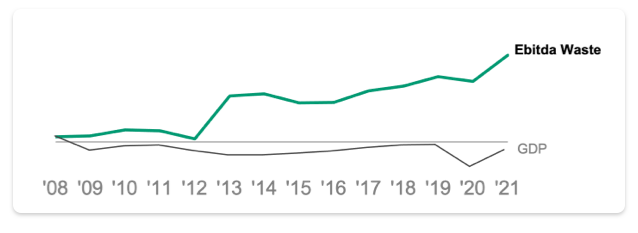
Energy
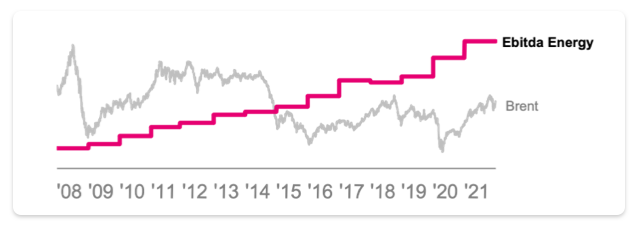
Rating S&P’s and MOODY’s
Growth drivers
Track record Ebitda by drivers
(M€)
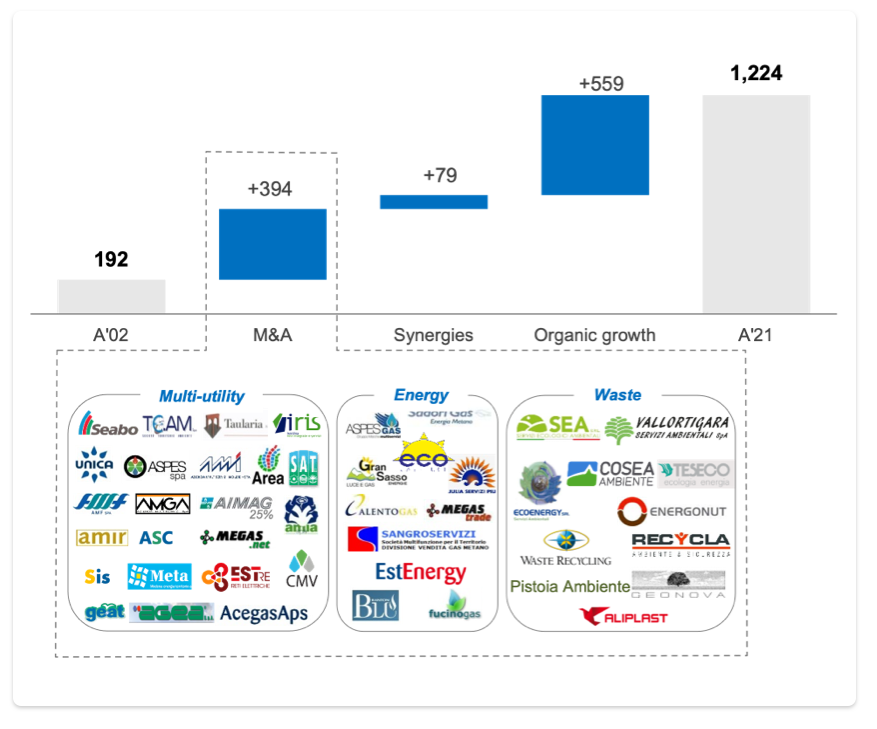
Strong cash generation
Cash flows resilient and un-interrupted growth
(Net proft+Depreciations, Capex)
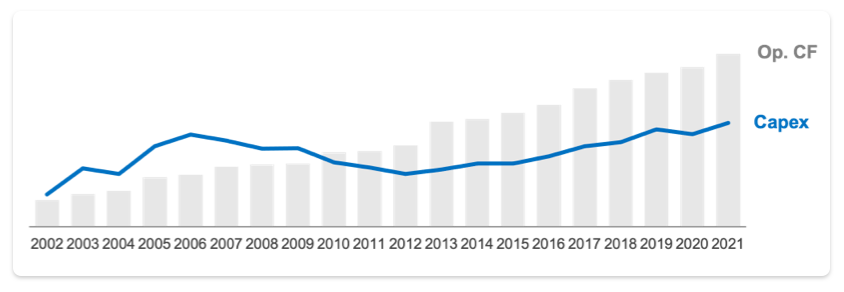
Debt/Ebitda
(x)
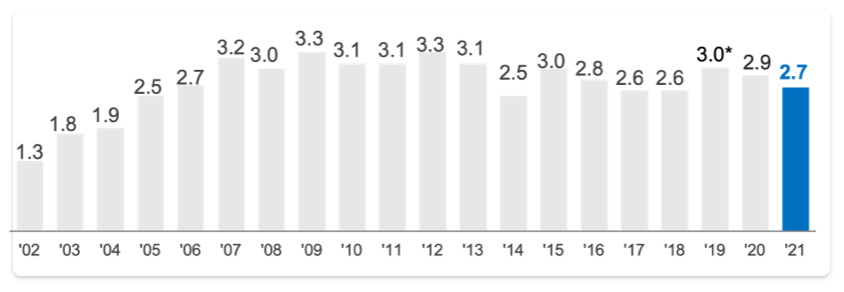
* Including figurative items (without cash outlay) as a result of the partnership with the Ascopiave Group in the sales sector
Value creation
Value creation
(ROI% vs WACC%)
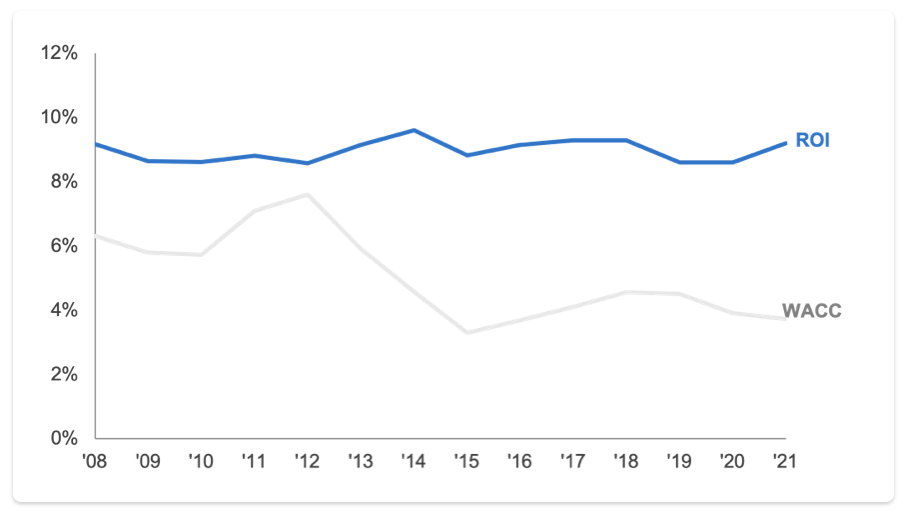
Capex
Infrastructure developments
(M€)
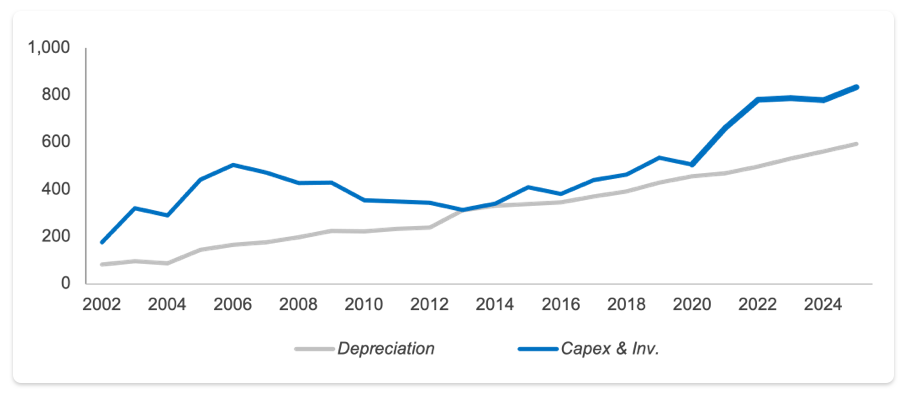
Valuation
Market P/E multiples
(x)
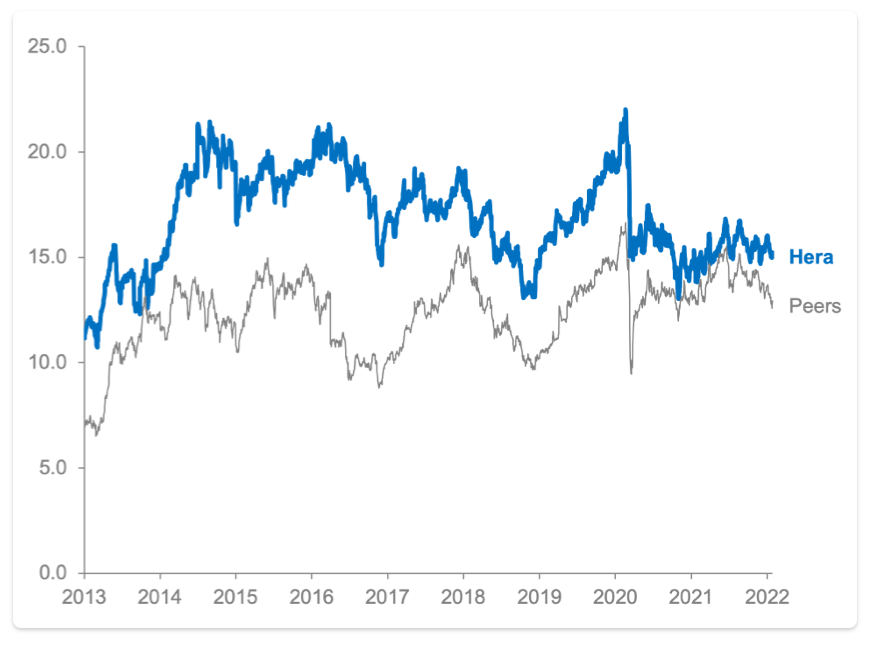
EBITDA/Employee
Ebitda per employee
(Ebitda per employee k€ per capita)
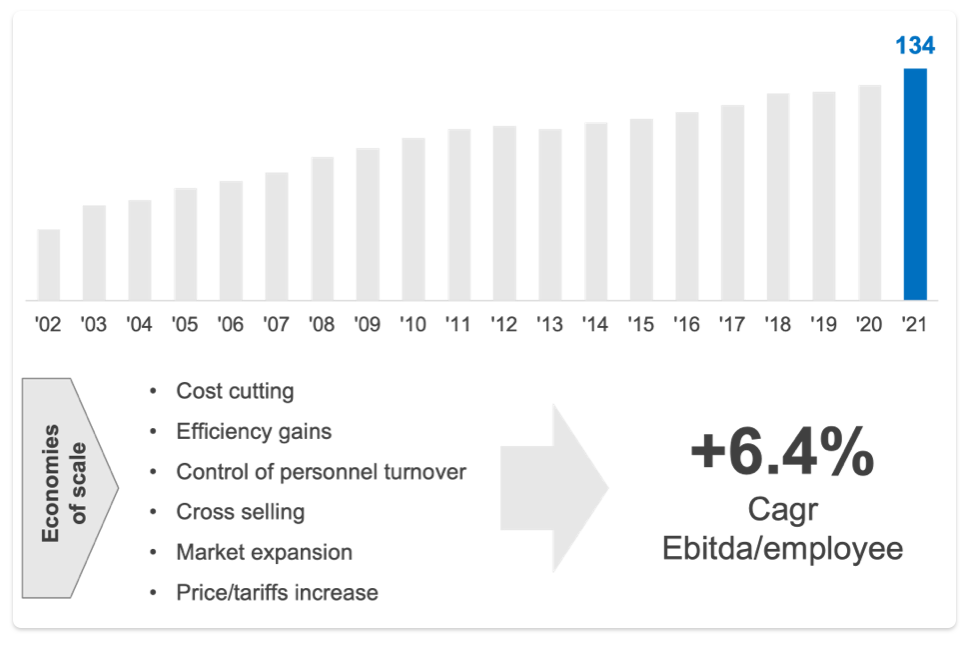
EPS and share evolution and share capital
EPS
(c€)
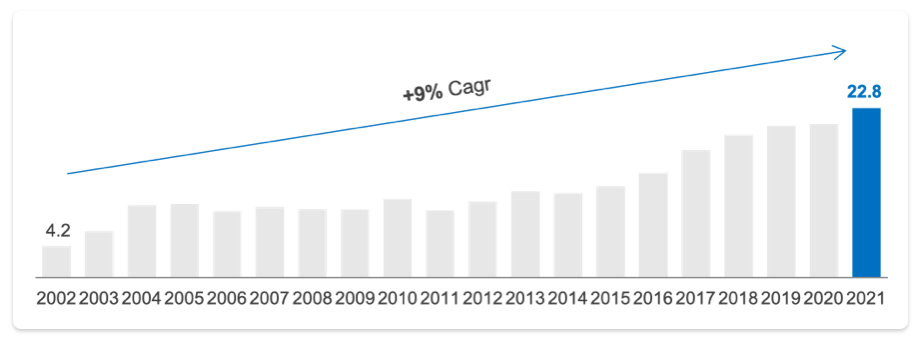
Share capital increase due to mergers executed
(mln of shares)
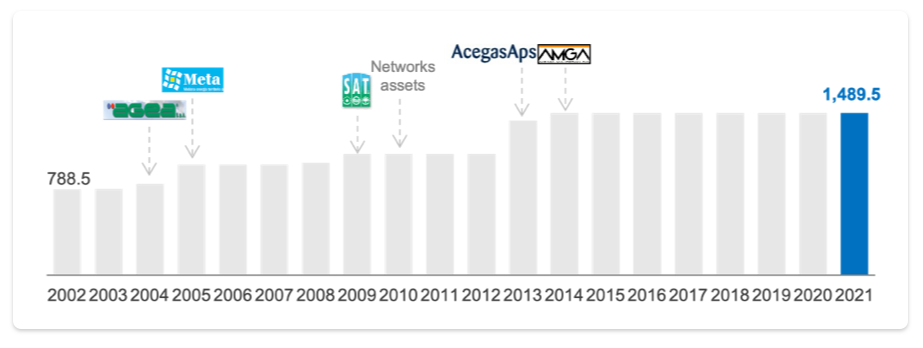
Debt/Ebitda
2002-2012: infrastructure renewal
(Debt/Ebitda)
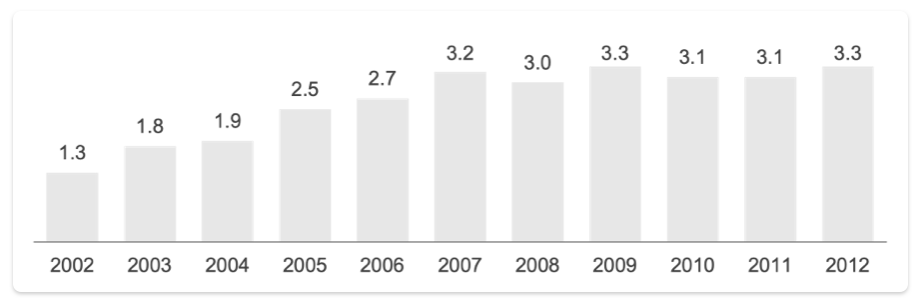
2012-2021: solid infrastructures
(Debt/Ebitda)
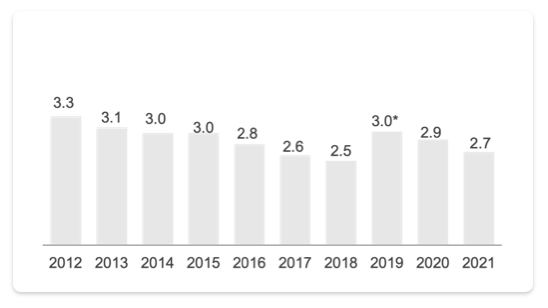
* Including the consolidation of the non-monetary effects resulting from the partnership with Ascopiave
Board of Directors (n° of BdD members)
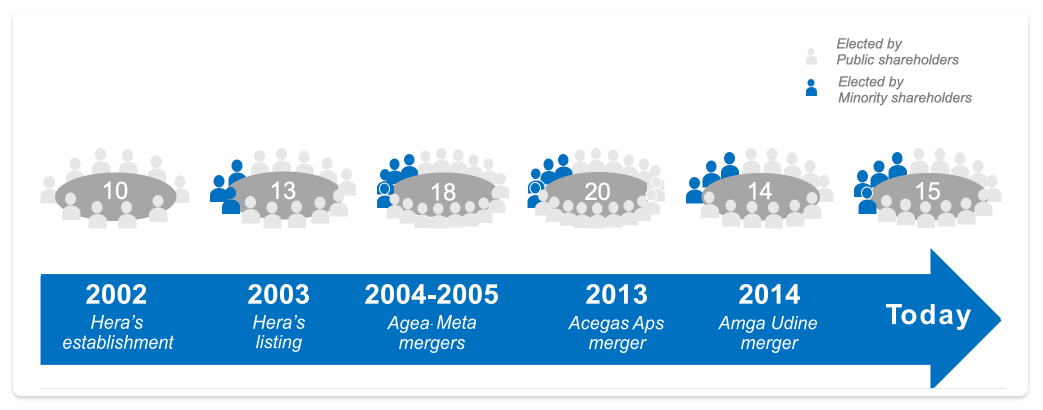

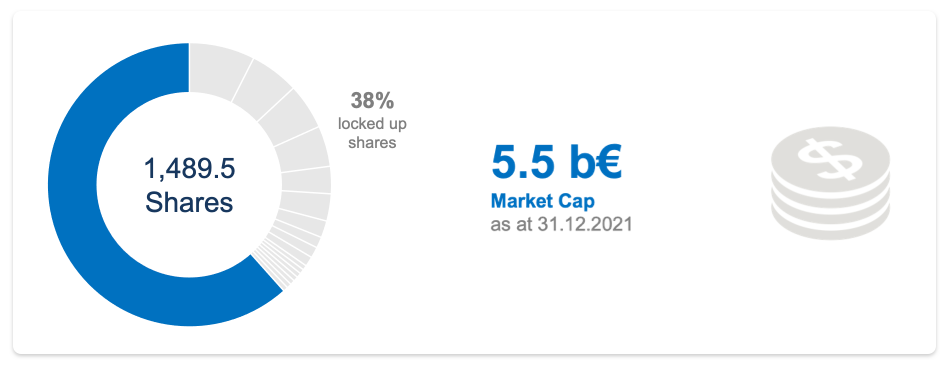
Reliable Dividends
Dividend policy
(c€)
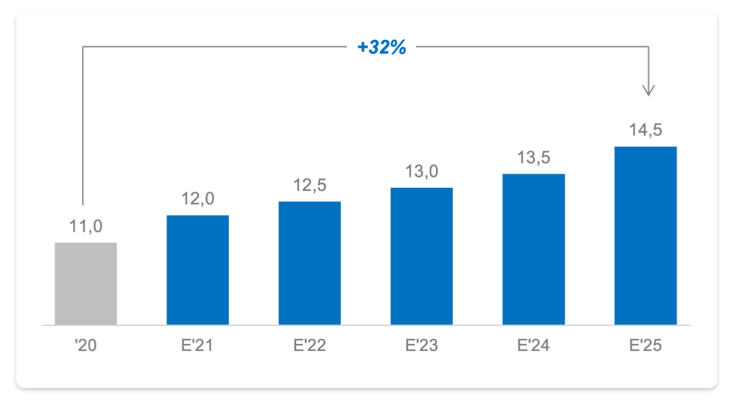
(as at 31.12.2021)
Dividend per Share
Dividend per Share
(c€)
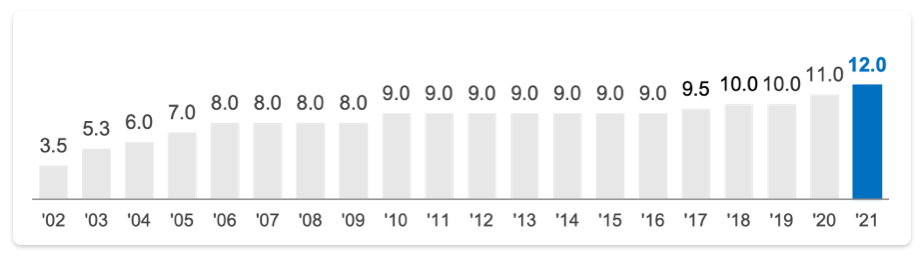
Payout
(%)
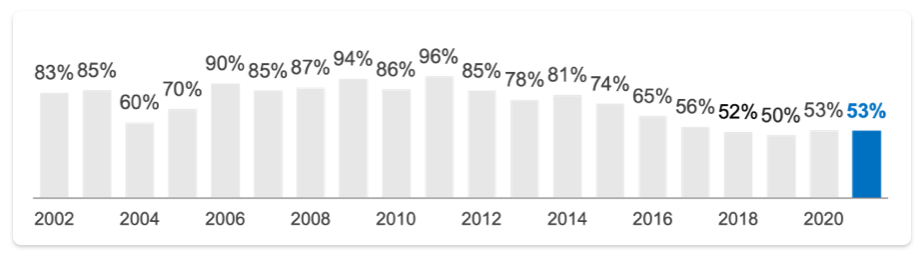
Since its establishment, Hera has always been committed to its stakeholders, in a constant attempt to combine economic and social development.
In 2016, a process was launched to identify the Hera approach to Creating Shared Value (CSV).
For Hera, the creation of shared value is achieved through all those business activities that generate operating margins while responding to the drivers of the global UN agenda on social/environmental issues.
The Group adheres to important global programs with a strong sustainability content and Hera share is included in several ESG indices:
Sustainability profile
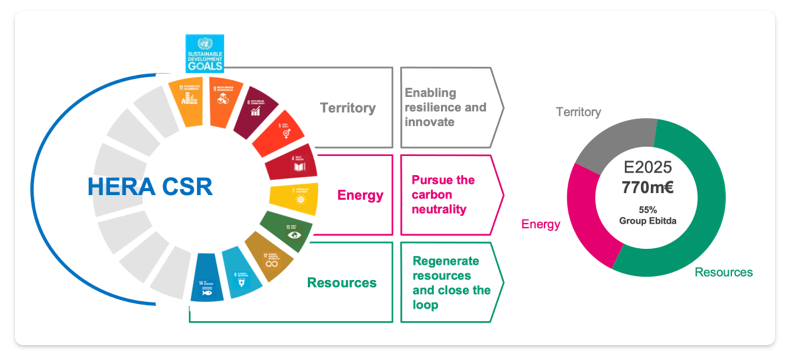
Main sustainability indicators for the 2021 financial year
570.6 m€
from shared value activities
46.6% of total Group Ebitda, +25% compared to 2020
452.7 m€
shared value investments expected to 2025
68% of total Group investments
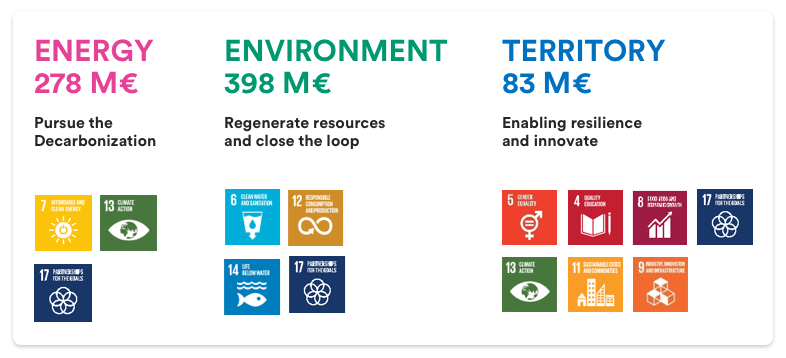
Download Center
Virtual Hera: le risposte che cerchi a portata di mano
Ciao sono VHERA, con l'Intelligenza Artificiale Generativa ti aiuto a trovare informazioni su obiettivi e risultati economico-finanziari e di sostenibilità nel sito del Gruppo Hera.
Stiamo aggiornando VHERA coi risultati finanziari e di sostenibilità 2025 del Gruppo Hera. Alcune risposte su questi contenuti sono già disponibili, mentre molte altre fanno ancora riferimento ai materiali 2024: il passaggio ai contenuti 2025 è in corso.
Si invita l'Utente a non inserire dati personali come nome, cognome, indirizzo, numero di telefono, ecc. durante l'interazione. Il chatbot non tratta informazioni personali per fornire una risposta. Lo storico della conversazione viene archiviato per un anno.
VHERA è il Chatbot messo a disposizione da Hera S.p.A., quale provider, sul sito istituzionale www.gruppohera.it per fornire informazioni riguardanti l'area Investor Relator e VCS.
Le risposte fornite da VHERA sono generate tramite sistemi di intelligenza artificiale generativa. In particolare, le risposte fornite dall’assistente virtuale sono elaborate sulla base dei contenuti già disponibili alla consultazione attraverso la normale navigazione del sito. VHERA offre risposte citando o producendo una sintesi del contenuto identificato come più probabile in relazione alle parole inserite nella domanda formulata dall’utente. Ogni risposta contiene il link della pagina utilizzata per la formulazione della risposta. L'obiettivo è offrire risposte utili e pertinenti, ma possono comunque verificarsi casi in cui le risposte risultino incomplete o imprecise.
Pertanto, ti consigliamo di verificare sempre le risposte fornite da VHERA e, se necessario, di proseguire la navigazione sul sito al fine di verificare la pertinenza dei contenuti suggeriti dall’assistente virtuale.
In ogni caso, se noti errori, inesattezze o anomalie nelle risposte, ti invitiamo a segnalarle tramite il feedback: il tuo contributo sarà prezioso per migliorare il servizio.
Le informazioni fornite da VHERA non rappresentano la posizione ufficiale di Hera S.p.A. e non devono essere considerate come consulenza professionale, né utilizzate come base per decisioni importanti. Per conoscere le posizioni ufficiali della Società, ti invitiamo ad utilizzare il canale istituzionale www.gruppohera.it e a fare riferimento alle fonti e alla reportistica ufficiale pubblicata dall'azienda a questi link:
https://www.gruppohera.it/gruppo/investitori/risultati-e-presentazioni/archivio
https://www.gruppohera.it/gruppo/sostenibilita/rendicontazione-di-sostenibilita/csv
Si segnala che nel rispetto delle regole di sicurezza, alcune domande potrebbero non ricevere risposta se non conformi ai criteri impostati.
Per approfondire il funzionamento di VHERA, consulta la Sezione - Scopri come funziona VHERA
VHERA è un chatbot basato su Intelligenza Artificiale Generativa di cui Hera S.p.A. è il provider. Grazie a questa tecnologia, risponde alle tue richieste interrogando i contenuti e i documenti più rilevanti presenti nel sito www.gruppohera.it. Per elaborare le risposte, VHERA prende in considerazione le pagine web e i documenti finanziari e di sostenibilità più recenti, i comunicati stampa degli ultimi due anni, il Codice Etico e altri materiali aziendali di particolare importanza.
Attraverso VHERA puoi approfondire le tematiche di tuo interesse e avere una panoramica aggiornata sulla
comunicazione corporate e istituzionale di Hera S.p.A..
Se invece desideri cercare una specifica informazione sulla gestione delle tue utenze, oppure per tematiche
inerenti il servizio clienti, comunicati stampa o news, puoi utilizzare la navigazione del sito o il motore di
ricerca tradizionale tramite l'icona della lente presente nella testata del sito www.gruppohera.it
Puoi infine fare riferimento alle fonti e alla reportistica pubblicata dall’azienda ai seguenti link:
https://www.gruppohera.it/gruppo/investitori/risultati-e-presentazioni/archivio
https://www.gruppohera.it/gruppo/sostenibilita/rendicontazione-di-sostenibilita/csv
Come ogni sistema basato su intelligenza artificiale generativa, VHERA si impegna a fornire risposte
utili e pertinenti, suggerire fonti ma, basandosi su logiche algoritmiche probabilistiche, può proporre anche
informazioni non pertinenti, incomplete o non del tutto precise: ti consigliamo quindi di verificarle e di
consultare le fonti ufficiali per confermare l'attendibilità delle informazioni ricevute.
Se la richiesta non trova una corrispondenza perfetta nei dati disponibili, VHERA può comunque generare
una risposta sulla base delle informazioni presenti nei propri sistemi: se noti errori o inesattezze, segnalali
tramite l'apposito strumento di feedback per aiutarci a migliorare il servizio.
Ricorda che le informazioni fornite da VHERA non riflettono la posizione ufficiale di Hera S.p.A. e non
sostituiscono la consultazione di documenti istituzionali e ufficiali, soprattutto per decisioni importanti o
questioni rilevanti.
Alcune domande potrebbero non ricevere risposta se non conformi ai criteri di sicurezza impostati; si fa
presente che l'inserimento di informazioni personali non è utile per una risposta del chatbot: ti chiediamo di
non inserire tale tipo di informazioni durante l'interazione con VHERA e di non utilizzare un linguaggio
inappropriato rispetto alle tematiche per cui è prevista l’interazione con l’assistente digitale, o comunque
discriminatorio, offensivo basato su identità, etnia, genere, religione, intimidatorio, riferito a pratiche
sessuali, nudità o contenuti osceni, relativo ad attività illegali.
L’utente si impegna a non:
utilizzare VHERA in qualsiasi modo che possa compromettere la disponibilità o l’accessibilità della stessa o renderla meno efficiente;
eludere o cercare di eludere le misure di sicurezza di VHERA e manomettere la tecnologia su cui l’assistente digitale si basa.
Alcuni suggerimenti utili per parlare con VHERA
Più la domanda è dettagliata e precisa, più VHERA potrà individuare una risposta puntuale e pertinente.
Se desideri cambiare argomento o porre domande su un contesto diverso, ti consigliamo di riavviare la chat attraverso il bottone "Riavvia": questo aiuta il sistema a "ripartire da zero" e a fornirti risposte più coerenti con il nuovo tema.
In caso di risposte errate, poco chiare o che ti sembrano "allucinazioni" del chatbot, puoi riavviare la conversazione con click su "Riavvia" per svuotare la chat e riprovare a porre la domanda in modo diverso.
Se lo strumento non risponde alla domanda o la risposta è incompleta, prova a riformulare la richiesta con termini diversi o a suddividerla in più domande: spesso il dialogo progressivo aiuta VHERA a comprendere meglio le tue esigenze.
VHERA comprende domande poste in quasi tutte le lingue, ma le risposte vengono fornite in italiano.
“AS IS” e “AS AVAILABLE” disclaimer
Il servizio attraverso VHERA è fornito nello stato in cui si trova e senza alcuna garanzia di buon
funzionamento. Pertanto, Hera S.p.A. non è tenuta a rilasciare alcun aggiornamento e non ha alcun obbligo di
eliminare gli eventuali difetti del servizio reso tramite VHERA.
Hera S.p.A. si impegna a fare quanto ragionevolmente possibile per mantenere l’accessibilità e le
funzionalità di VHERA, senza peraltro in alcun modo garantire l’accesso continuo, ininterrotto e sicuro
all’assistente virtuale in questione. Pertanto, Hera S.p.A. non sarà responsabile per qualsiasi disfunzione
nell’accesso o utilizzo di VHERA.
Hera S.p.A. non fornisce alcuna garanzia o impegno, e non rilascia alcuna dichiarazione che l’utilizzo di
VHERA soddisferà le aspettative dell'utente, raggiungerà i risultati previsti dall’utente, funzionerà senza
interruzioni.
Per conoscere le linee guida Hera sull'adozione dell'intelligenza artificiale generativa, consulta il documento:
IL NOSTRO IMPEGNO NELL'UTILIZZO DELL'INTELLIGENZA ARTIFICIALESei sicuro di voler riavviare la chat?
Se vuoi salvare le informazioni puoi copiarla prima di riavviare la conversazione