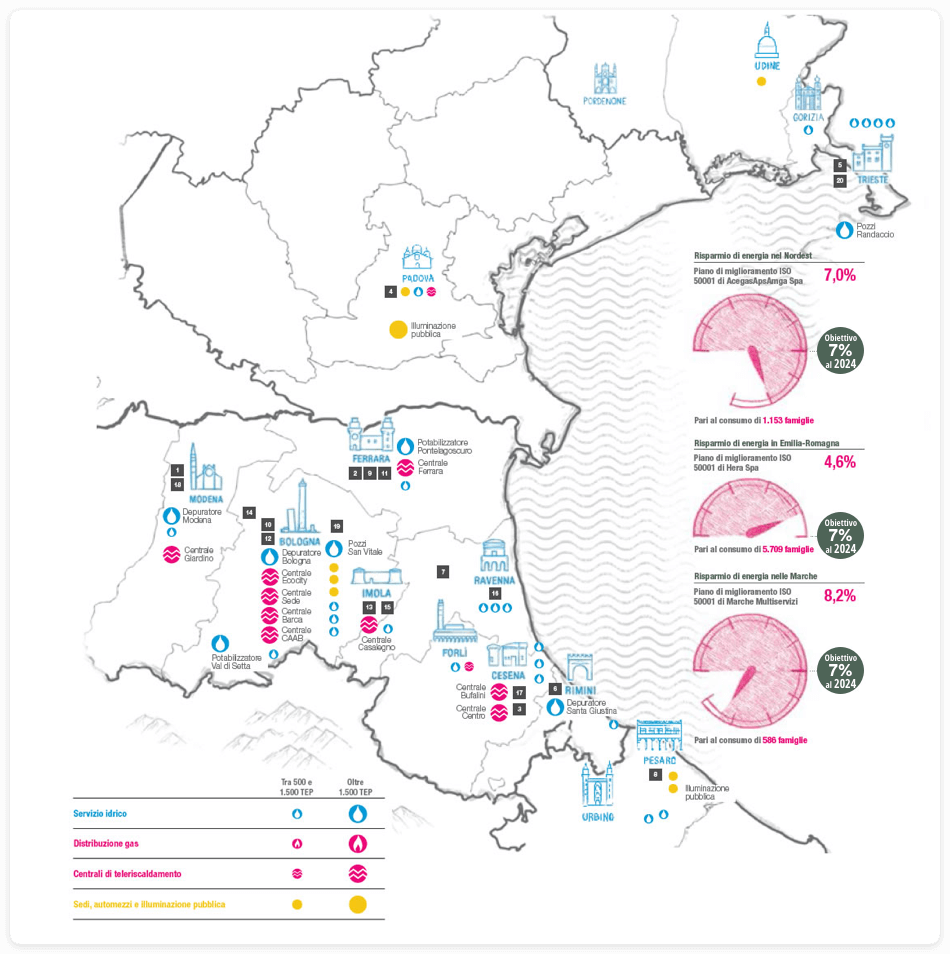
Group energy performance indicators show how performance is evolving and illustrate relative targets, giving an overall picture of corporate saving strategies. In general, consumption intensity ratings reflect the improvements generated by efficiency-enhancing and energy management solutions.
The energy efficiency index of purification has increased as a result of lower volumes treated, while energy consumption has remained substantially stable due to the very nature of the plants. The energy consumption for drinking water has increased more than proportionally to the volumes treated, causing a deterioration of the efficiency index. This is because consumption depends not only on the volumes treated, but also on other factors, including the drought that occurred in 2017, which required the use of less energy-efficient sources. The consumption of energy for the district heating service and the value of the thermal energy fed into the network increased slightly, with a substantially stable efficiency index. The vehicle efficiency index is back to 2015 levels, after a short peak in 2016. The public lighting index improved thanks to energy efficiency measures.
Natural gas is used by the waste-to-energy plants during start-up and shut-down and to support combustion if the calorific value of the waste being treated is low: the overall consumption of 2017, excluding Hestambiente and the Enomondo plant, was over 8 million m3. Compared with 2016, there was an increase in natural gas consumption by over 860,000 cubic metres despite the 2% decrease in waste treated, hence the worsening of the energy efficiency index. This increase is mainly due to an increase in natural gas consumption at the Ravenna, Forlì, Bologna and Ferrara plants, partly offset by a reduction in consumption at the Ravenna incinerator and at the Modena waste-to-energy plant.
2012* | 2015 | 2016 | 2017 | D 17/16 % | ||
---|---|---|---|---|---|---|
Treatment | primary energy (toe)/volumes treated (thousands of m3) | 144.9 | 102.8 | 103.6 | 109.7 | +5.9% |
Purification | primary energy (toe)/water fed into the water network (thousands of m3) | - | 84.1 | 80.7 | 85.8 | +6.3% |
District heating | primary energy (toe) / thermal energy introduced into mains system (MWh) | 208.4 | 182.8 | 178.6 | 179.5 | +0.5% |
Waste-to-energy plants | primary energy (toe) / treated volumes (000 t) | 27.7 | 25.5 | 26.7 | 27.0 | +1.1% |
Office management | primary energy (kWh) / office surface area (m2) | 99.5 | 82.0 | 83.5 | 83.8 | +0.3% |
Heating of premises | primary energy (toe) / heated volumes (days*m3/1000) | 1.88 | 1.52 | 1.20 | 1.12 | -6.3% |
Vehicles | primary energy (toe) / distance travelled by vehicles (mln km) | 201.5 | 156.8 | 161.7 | 157.4 | -2.7% |
Public lighting | primary energy (toe) / 000 lights | 91.5 | 80.1 | 76.5 | 68.5 | -10.2% |
The data refers to Hera S.p.A., Herambiente, Hera Luce, Marche Multiservizi and AcegasApsAmga.
*Does not include AcegasApsAmga and Marche Multiservizi.